FXNEWSCLUB
EssentialTechnical Analysis (H4 Chart) Trend Structure Price is moving inside an ascending channel (black lines). Currently testing the mid-upper zone of the channel, near $3,400–$3,407 resistance. Key Levels Support: $3,380 / $3,340 / $3,300 Resistance: $3,407 / $3,486 / $3,544 Major psychological support at $3,244. Patterns Blue arrows mark previous strong...
Technical Analysis (XAU/USD – 4H) Pattern: Rounded Top + Rising Channel Breakout Breakdown: Price broke below rising channel and retested as resistance Bearish Target Zones: First Support: $3,288 Final Target: $3,247 Invalidation: Bullish only if price reclaims $3,345–$3,355 📉 Fundamental Overview USD Strength: Pressuring gold due to strong US data Fed...
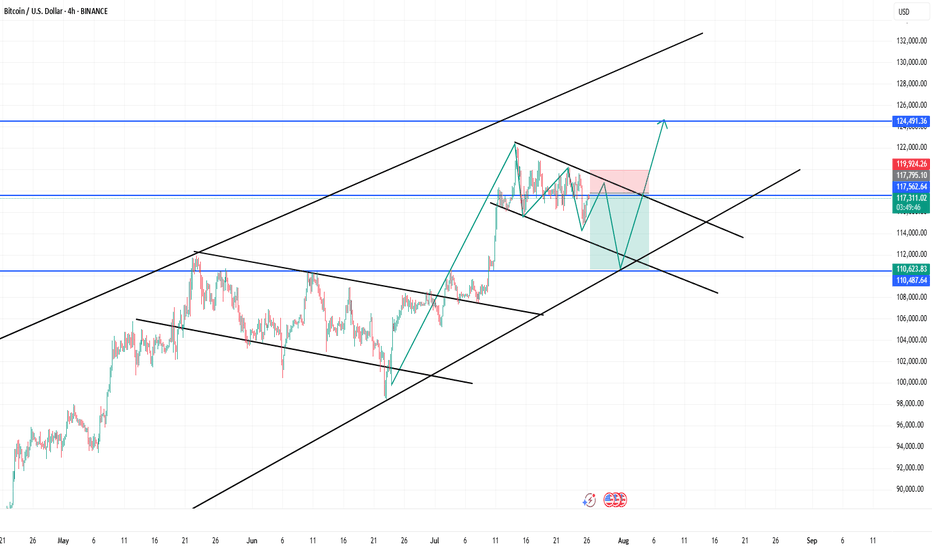
Technical Analysis (4H Chart) 🔷 Pattern Overview: Rising Channel: BTC is still respecting a long-term upward channel (black parallel trendlines). Falling Wedge (Short-Term): Inside the channel, a falling wedge is forming—typically a bullish continuation signal. The wedge is nearing completion, with a possible fakeout below support to the $110,500–$110,600 zone...
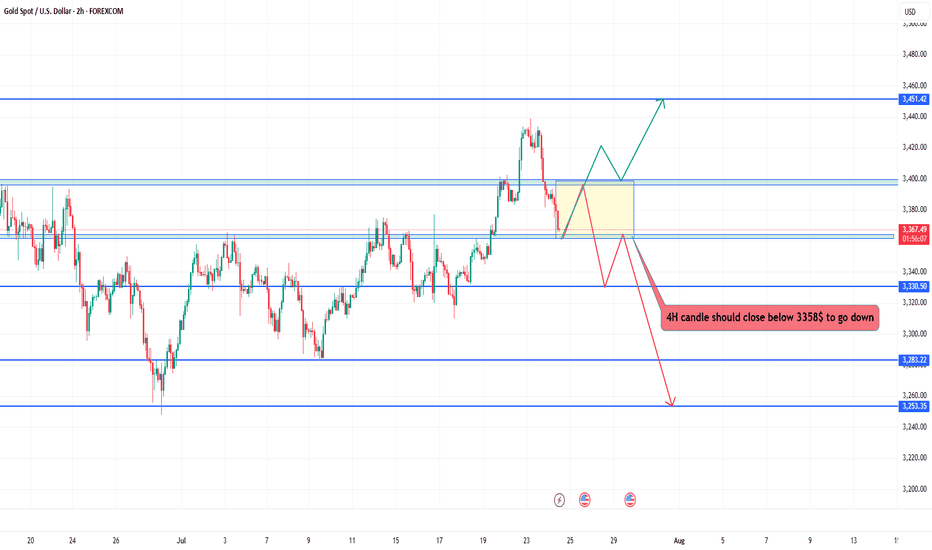
Technical Analysis Key Levels: Resistance Zones: $3,451.42 – Major resistance. ~$3,410 – Mid-range resistance zone. Support Zones: $3,358 – Key support zone (critical level). $3,330.50 – Secondary support. $3,283.22 and $3,253.35 – Deeper support levels. Current Price Action: Price is currently trading at $3,366.47, pulling back after hitting a local...
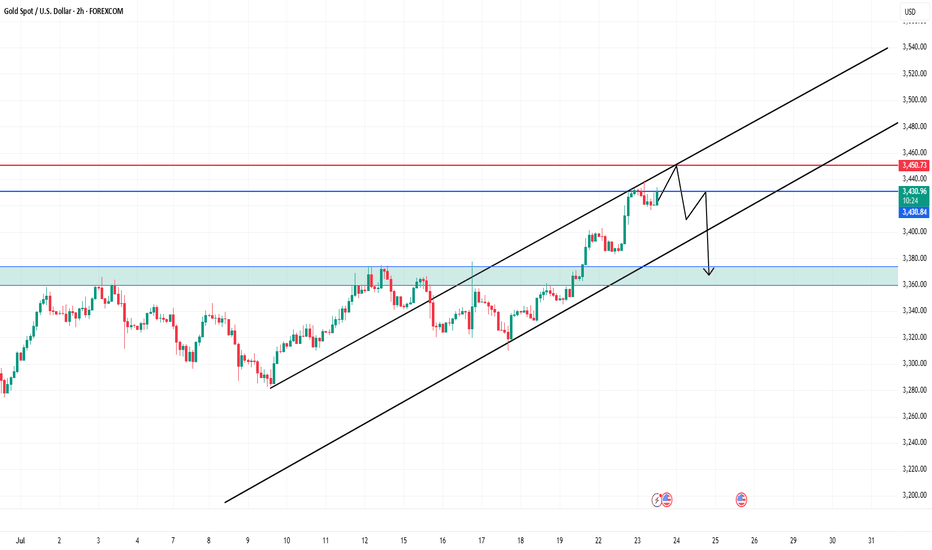
Technical Analysis (2H Chart) 1. Trend Structure: Price is moving in a clear ascending channel (black trend lines). Currently testing the upper boundary of the channel, which may act as resistance. 2. Resistance Zones: $3,431–$3,450: Strong resistance zone. Horizontal resistance at $3,450.73 (marked in red). Price may form a lower high before reversal, as...
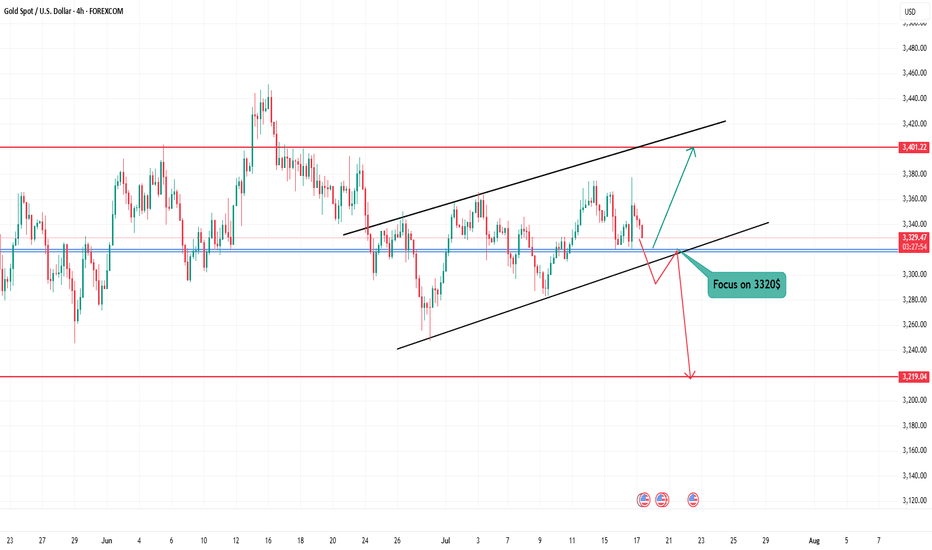
Technical Analysis – 4H Chart Gold is trading within a rising channel, but momentum is weakening. The current price action is testing the lower channel support around $3,320 — a critical level for the next directional move. 🟥 Bearish Scenario: Break & close below $3,320 could confirm channel breakdown Target: $3,219 support zone Bearish engulfing seen on...
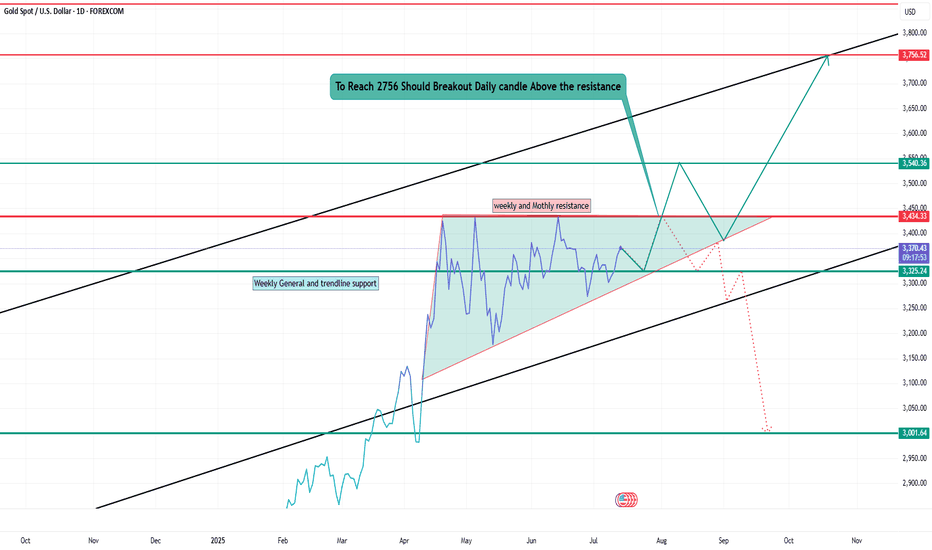
Technical Analysis – XAU/USD Current Price: $3,371 Gold is trading inside a rising wedge pattern with strong resistance at $3,434. A daily candle close above $3,434 could trigger a breakout toward: 🎯 Target 1: $3,540 🎯 Target 2: $3,756 If rejected at resistance, price may drop to: ⚠️ Support 1: $3,325 ⚠️ Support 2: $3,001 (major weekly support) 🌍...
USD/JPY Analysis – July 2025 🔍 Technical: Price: 144.50 Key Resistance: 149.50 Key Support: 140.12, then 117.64 Two possible moves: Bullish: Break above 149.50 → Target 156+ Bearish: Stay below 149.50 → Drop to 140 → 128 → 117 🌍 Fundamental: USD Strength: If inflation stays high, Fed may delay rate cuts. JPY Strength: BOJ may shift policy or intervene if...
🔧 Technical: Trading in a clear downtrend channel Key resistance: 100.08 Target: 91.83, then 87.64 Bearish bias remains unless price breaks above 102.33 🌍 Fundamentals: Fed rate cut expectations weighing on the dollar Weak U.S. data and slowing inflation support downside Global shift away from USD adds pressure 📉 Headline: “DXY Weakens Below 100 –...
XAUUSD Analysis – June 3, 2025 🔧 Technical: Price is moving in an ascending channel. Key support: $3,335 | Key resistance: $3,414 Bullish setup: Bounce from lower channel → target $3,414 Invalidation if price breaks below $3,321 🌍 Fundamentals: Fed rate cut hopes + weak USD = bullish for gold Central banks buying + geopolitical tensions support...
🔷 Trend: Bullish in Ascending Channel Gold is respecting a rising channel with a recent bounce from the lower boundary near $3,320. 🟢 Upside Targets: $3,356 $3,400 $3,440 $3,517 (major resistance) 🛑 Key Support: $3,320 (trendline support) Break below $3,310 invalidates the bullish setup ✅ Plan: Buy on dips near $3,320 with targets toward $3,517. Stop loss...
Technical & Fundamental Analysis for XAUUSD (Gold/USD) – H4 Chart as of May 20, 2025 🧠 Technical Analysis: Pattern Observed: A symmetrical triangle pattern has formed, indicating a phase of consolidation. Price is now squeezing at the apex of the triangle, suggesting an imminent breakout. Two possible breakout paths are illustrated: Bullish breakout targeting...
XAUUSD (Gold/USD) based on your 4H chart: 🔍 Technical Analysis 1. Chart Pattern: Rounded Top / M Pattern: Clearly visible on the chart. This suggests bearish reversal, indicating buyers lost control. 2. Breakout Confirmation: Price broke the neckline of the rounded top. Formed a bearish flag/channel after the drop (a continuation pattern). Price is currently...
Gold (XAUUSD) Daily Analysis – May 12, 2025 📈 Technical Analysis 🔹 Key Support Zone Holding: Price is currently reacting at a confluence of Weekly and Daily trendline support, located near the $3,200–$3,220 area. This zone is critical. As long as it holds, the bullish structure remains valid. 🔹 Bullish Continuation Pattern: A falling wedge pattern (black...
XAUUSD (Gold/USD) – 1H Chart 📊 Technical Analysis: Chart Pattern: The chart shows a clear bearish market structure, with successive lower highs and lower lows forming. A bear flag or corrective structure broke to the downside, confirming bearish continuation. There's a clear liquidity sweep near the resistance zone (red area) followed by a rejection,...
Gold (XAUUSD) Analysis – May 6, 2025 📈 Technical Outlook: Gold Eyes $3,418 as Bullish Channel Holds Gold continues to trade within a rising channel on the 30-minute chart, with price currently near the mid-range around $3,373. Two likely scenarios: Bullish breakout toward $3,418 if minor resistance fails. Or a healthy pullback to $3,360–$3,345 support zone...
🔍 Technical Analysis (XAU/USD – Gold Spot, 1H Chart) 🔹 Chart Structure & Trendlines Descending Trendline Breakout: Price has decisively broken above the long-standing descending trendline, indicating a potential bullish trend reversal. Horizontal Support/Resistance: Key support zone: Around 3260–3270, shown with horizontal cyan lines and multiple bounce points...
Gold (XAU/USD) – Technical & Fundamental Analysis 🔹 Technical Analysis Current Price: $3,240.39 Trend Context: Gold remains in a broad ascending channel, with price action currently consolidating below all-time highs (ATH). The structure remains bullish unless key support levels are decisively broken. Key Technical Levels: Resistance Zones: $3,339 – Monthly...


