Forever-Learner
EssentialPackages broke its previous high of Dec 20' last month. Now the immediate resistance it will face is around 650 which is the trendline resistance. Then it will face resistance at 680 (Fib 0.618 level of all-time high). Then 730 - 750 (another trendline resistance). Then around 800 (Fib 0.786 level of all-time high). Once it surpasses all these, it may touch its...
On a daily timeframe, OGDC has given breakout of a triangle pattern. This will open up doors for it to move towards its all-time high i.e. ~290 region. This is my personal opinion, not a buy / sell call. All other indicators e.g. RSI, Stoch and MACD are bullish as well.
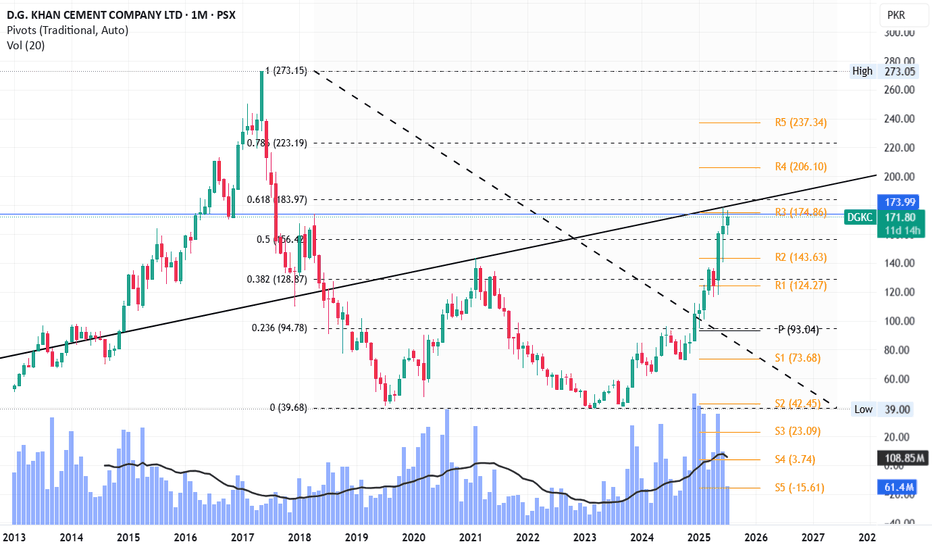
Currently the trendline and previous resistance level (173 - 179) are stopping it from going upward. Fib 0.618 level is also near (184) which will be again a major hurdle before it goes further up towards 223 and 273. However, RSI, MACD and Stoch are fine that suggest no extreme pressure for the price to go downwards yet.
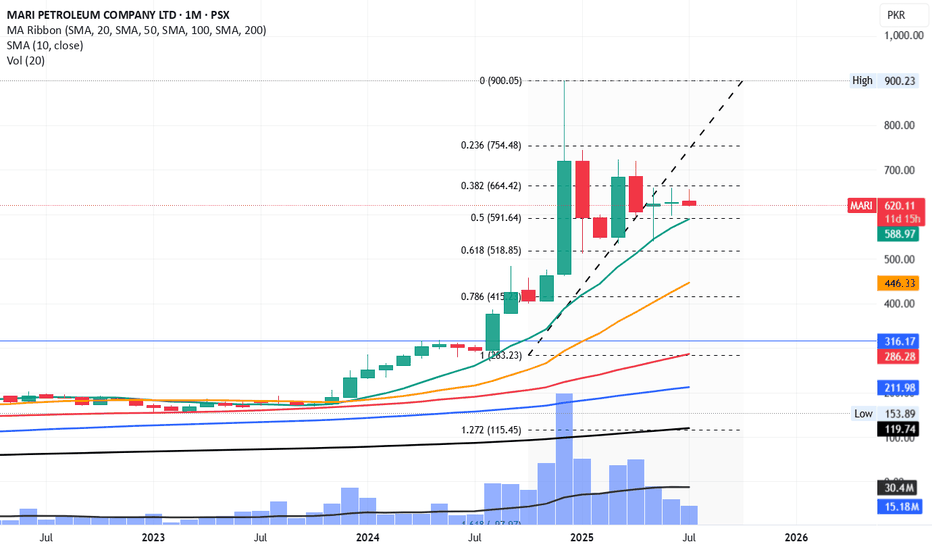
Since July 2023, Mari has never breached and closed below SMA10 on monthly timeframe. If it breaches it and closes below 588, the downfall will be sharp. Its first stop would be 519 and then 446 and 415 can also be on cards. Sorry for Mari lovers but it can become a harsh reality. However, 415 to 446 can be an ideal time for accumulation for long term investment...
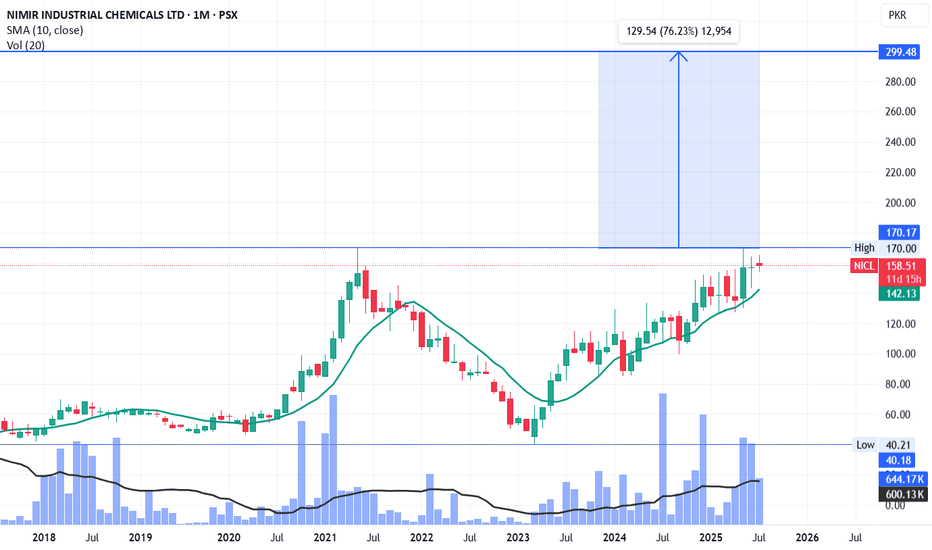
Its on all-time high level. SMA10 is still a bit behind but will soon catch up. Price has to touch SMA-10 now before moving upwards to its projected target of ~300. Volumes are suggesting that accumulation is happening.
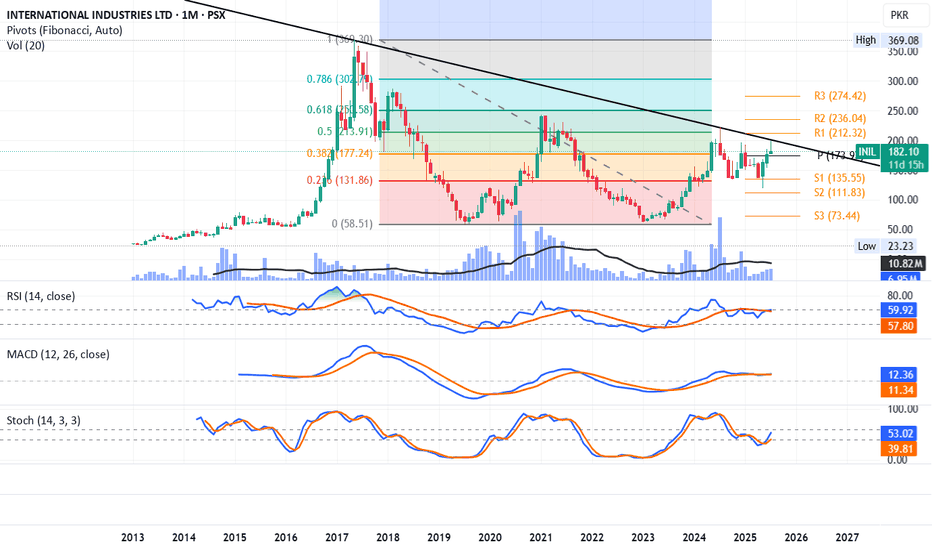
RSI, MACD and Stoch, all are giving buy signal. INIL has tested its monthly support 1 twice, forming a small W which is a bullish pattern. It is trending above its monthly pivot (174). Currently, the trendline is stopping it and breaking it will not only make it retest its R1 (212) but also 250 (R2) soon. Volumes are not supporting though but once it breaks the...
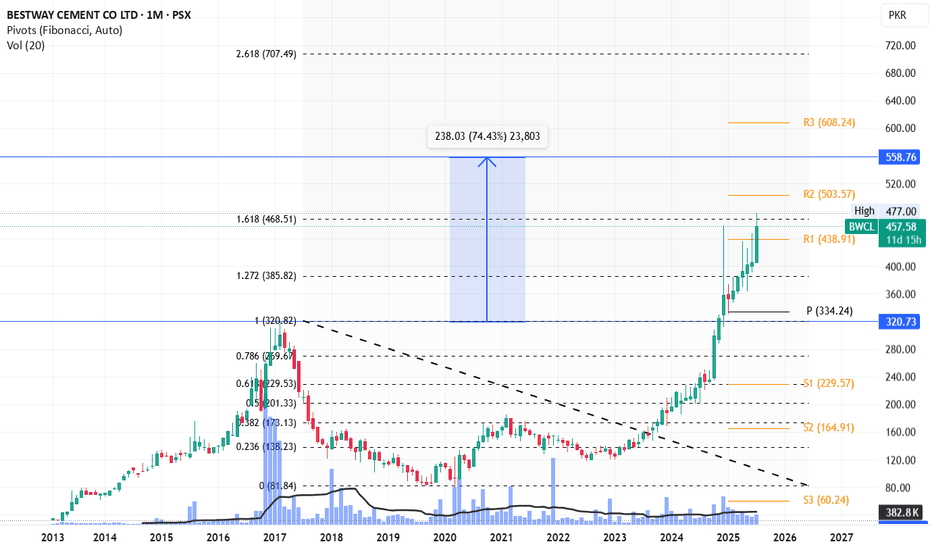
BWCL is facing some resistance from its Fib 1.618 level, however its testing it second time now and may break it to move towards 558. If the momentum supports it, it may touch 700 as well, but caution should be taken above 558 with trailing stoploss.
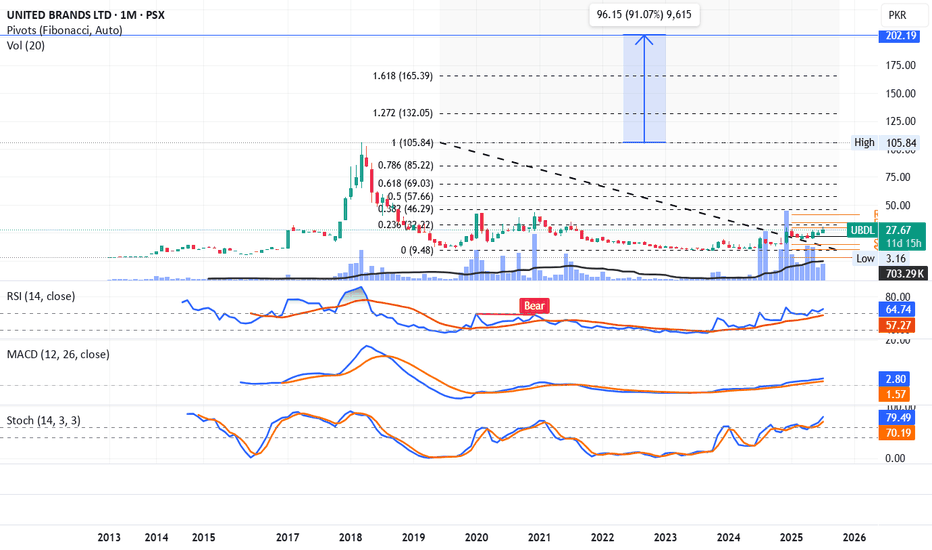
A nice cup and handle formation in place. UBDL is trending above monthly pivot. RSI, MACD and Stoch all are giving buy signal and increasing volumes are also indicating the same. Its a reversal stock and may move slowly. Further targets are 32, 46, 57, 69, 85 and then 105 (its all-time high). Once it reaches there, 200 can be up for the grabs, but it may take 2-3...
ACPL tried to break its all-time high first time and failed. It may retrace to Fib-0.618 level (~260) where its SMA10 will push it upwards again. However, it may take some time that it breaks its all-time high and go for new highs. Ultimate target (580) is mentioned in chart.
Currently Fib 0.5 of its all-time high and its last peak - both are showing resistance. Once it breaks the level, the trendline will act as resistance (~114). After that it may speed-up towards its next targets of 121, 146 and previous all-time high.
Forming a nice H&S pattern on monthly TF. RSI, Stoch are bullish. Next target can be the neckline top (~495) and then ~720 once it breaks neckline.
EngroH is going to form an M pattern for which it has to take a bounce and then will fall back. Bounce can be expected to Fib-0.618 (212) or Fib-0.786 level (245). RSI and Stoch are in recovery phase. MACD still bearish. Playing on levels should be prioritized with trailing stoploss once it reaches 212. Exit should be planned near 245. Staying long can be...
From latest bottom till the breakout level which conservatively I'll take at 1159, the most possible target is ~1800.
Fib 0.236 level from last peak and trend line is the main hurdle. Once it breaks, resistances on pivots and other Fib levels will be the targets.
UDPL has very strong fundamentals (P/E: 2.3, EPS: ~30) Its a dividend paying stock as well. It is building cup and handle formation with the channel top line working as major resistance. It took a correction from Fib 0.786 level of previous all-time high. Once 80 (Channel top line) is broken, we can see it moving towards 91 which is its previous all-time...
Golden cross on weekly time frame. RSI has cooled down and is ready to take off again. Possible target is 77.
Hino broke its downward channel line in November 24. It posted a high of 545 in Jan 25 and came back to retest the level which broke the downward channel (~300). Now it is exactly at its Fib 0.236 level, crossing which, it will pace up and move towards its next levels. Next levels are: 545, 589, 721 and 853 in short to medium term. Long terms target can be its...
Long term targets for NETSOL once it breaks out the triangle are listed in chart. You can take it either as Fib 1.618 or the price arrow top as your targets.


