HarmonicTA
PremiumThis looks like what RBLX did, i couldnt hold onto that to save my life. ill try again with this name. 1t-$90 2t-110 fomo kicks literally will just try to hold, face rip please. glhf
flags everywhere, and its weird. it feels odd to repeat the same process but thats all the market does and it works... t1 $4.20 t2 $5.00 opened $5 strikes in sept., glhf
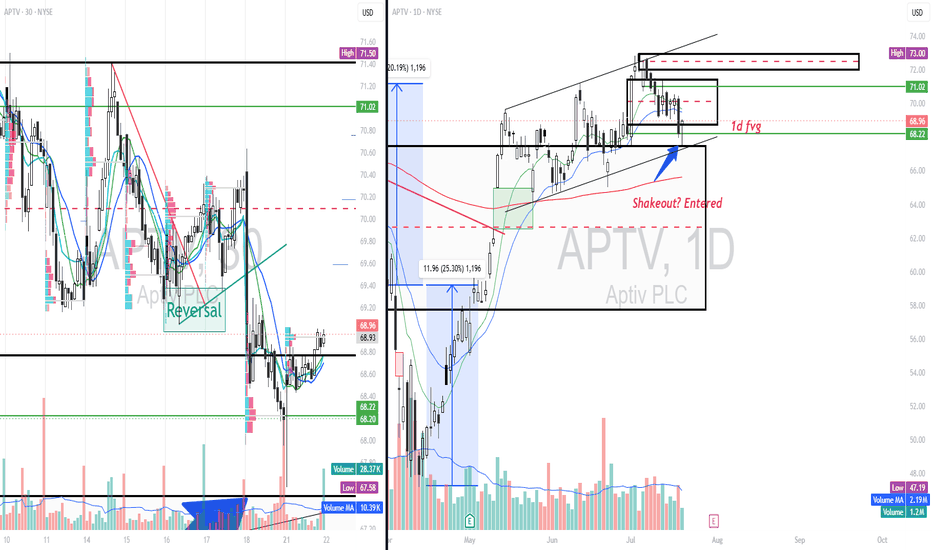
APTV shows healthy bullish sentiment. HH/HL, and dips to get in or get shaken out. I entered on todays retouch of a support FVG and a shakeout of the 1d FVG. 25dte 70c. GLHF, NOT FINANCIAL ADVISE. I USUALLY LOSE
watching NVDA on breakdown or failure of breakdown Harmonic. increased volume at double bottom and D PRZ suggests to me this will not breakdown, but i dont think it wont chop away my confidence either. ill just wait for the direction.
Huge tail on this in larger frames, and another huge hmnc on daily. see flagging into gap...if info TL holds any weight ill find out. tossed coin at NASDAQ:PYPL $80 6-27-25 call @ 0.15; at that price...Why not.
T mobile run seems to been exhausted and setting up. Weekly and Daily setup so anticipate a lot of head spin but on my radar. For now short seems to be my bias. 242.25 shows to be POC before 220 target of max pain. 218-209 is the area of interest for base bullish harmonic.
Part of a larger analysis, at the moment Tsla rejected 332 B pivot and imo retesting possible b.o. area. missed gap up open, retest of highs sent 305p strike. looking to close at 310-305 tgt zone. n.f.a. g.l.h.f
def juice to the downside right now, media attn is insane. But theirs major harmonics at play. and ill be buying at those lows and posting long, until then. dont fight it. t3 almost hit of momentum measure. actually insane moves
long RIVN on Flag formation inside CUP/HANDLE, consolidating at daily FVG, with upside 4h FVG. Long exposure August $17 strike.
Gold is in a lot of media right now and everyone probably has some exposure, i myself am here and as are you. Im taking my chips and placing it on a short setup before a run if there is one. Three drives pattens on candles with bearish sentiment TA, LL, LH, opex is over, yada yada. GL
gap down 3x tapping megaphone targetting highs for exhaustion? or b/o? trades their, gl
AMEX:SPY trade, watching this pivot level for 2nd flag continuation into 560's or a break down to retest lows. Overall trend is bearish, so until bulls show themselves, the continues voice that yells buy this dip, is nulled by the sense of, FOMO temptation. never plays out well. No actual trade deals made, no actual announcements. just headlines and people...
Was tracking /es bullishly, but vigilant. Then caught this h/s pattern print i published and traded to the upside. Since i have watched an am now short from C pivot on abcd pattern. stop is a break of the 3930 zone, invalidating the h/s top formation by breaking the right shoulder, after 5 failed attemps as of 3/1/2021. Cheers.
H/s formation atm with a base measure and sprt target zone of 3820-3807. A buy alert set for 3820 with a stop 3805. Measured move of h/s and fib measure indicates another attempt at ATH and zone levels 3987 as a primary target to an extension of 4021. All invalidated with a trade below 3807, which is been a pivot on the hourly since 01/7/21.
/RTY has the cleaner of the looking setups so far. Larger term inv. h/s targeting ATH(red box), needing a push into the right wing of the inv. h/s at 1592.2, then a breakout of 1618.7 for possible continuation for ATH attempt. Inv. h/s sprt at right shoulder validates ATH attempt, upon breach pattern is violated; hence the stop of 1520.2
Seeing the h/s setup on the 1hr based at a support level, with recovering stoch/rsi and closed with a daily hammer close, for a possible reversion in price. Hourly closed over first resistance, but not 2nd, a break of the buy up wick is the stop on the play, but a target of 213+ into gap zone is upside target.
Been tracking IWM since h/s should breakdown, and was long on market from spy harmonic and the touch on bottom of chute, on personal analysis saw res. at 155, see now 156. Bearish harmonic at gap above C pivot coubld be possible target before bounce. NO positions just tracking for indication. area in ellipse possible right shoulder for large timeframe inv. h/s
At the moment FB has been in a box more consolidating than falling imo, as opposed to what other may think. Bearish harmonic played out, see if Bullish harmonic can too, targeting B for now at 166. update then, D support breached on a daily or possibly 4hr close would violate this long.


