Harry_Megat
Ethereum (ETH/USD) Technical Insights **Chart Overview** * **Current Price**: \~\$3,631 * **EMA 7 (Red Line)**: \$3,720.80 * **EMA 21 (Blue Line)**: \$3,522.96 * **Key Support Zone (Pink area)**: \~\$3,600–\$3,650 * **Support 1 (S1)**: \~\$2,950 * **Support 2 (S2)**: \~\$2,500 * **Uptrend Line**: Still intact, but under pressure **Technical Insights** *...
Analysis BTC/USD Daily Chart **Chart Overview (Daily Timeframe)** **Current Price**: \~\$114,937 **EMA 7**: \$116,896 (short-term) **EMA 21**: \$116,561 (medium-term) **Trendline**: Price is testing the long-term ascending trendline **Key Zones:** * **Support 1 (S1)**: \~\$110,000 * **Support 2 (S2)**: \~\$102,000 * **Immediate Resistance Zone**:...
Gold (XAU/USD) on the 1‑hour timeframe Chart Structure & Bias * Price remains trapped in a **rising channel** (\~\$3,328–3,333), pressing against resistance near **\$3,340–3,345**. * Short-term momentum is bearish: both EMA 7 and EMA 21 sit above current price, with declining volume signaling weakening buyer strength. * Overall trend leans neutral‑to‑bearish...
US Dollar Index (DXY) Chart Analysis – 1H Timeframe This chart shows the **US Dollar Index (DXY)** with key price zones, trendlines, and EMA indicators. Here's a detailed analysis: **Key Observations:** * **Price:** Currently trading near **98.41** * **EMAs:** * **EMA 7** = 98.373 (short-term trend) * **EMA 21** = 98.356 (medium-term trend) *...
Gold (XAU/USD) 1H Chart Analysis **Current Trend:** Consolidation within a range **Price:** \$3,335–\$3,336 **Indicators:** * EMA 7: \$3,336.92 * EMA 21: \$3,339.36 * Price trading slightly below both EMAs – **short-term bearish pressure** --- ### 🔍 **Key Levels** * **Resistance Zone:** \$3,344–\$3,348 * **Support Zone:** \$3,324–\$3,328 --- ### 📊 **Trade...
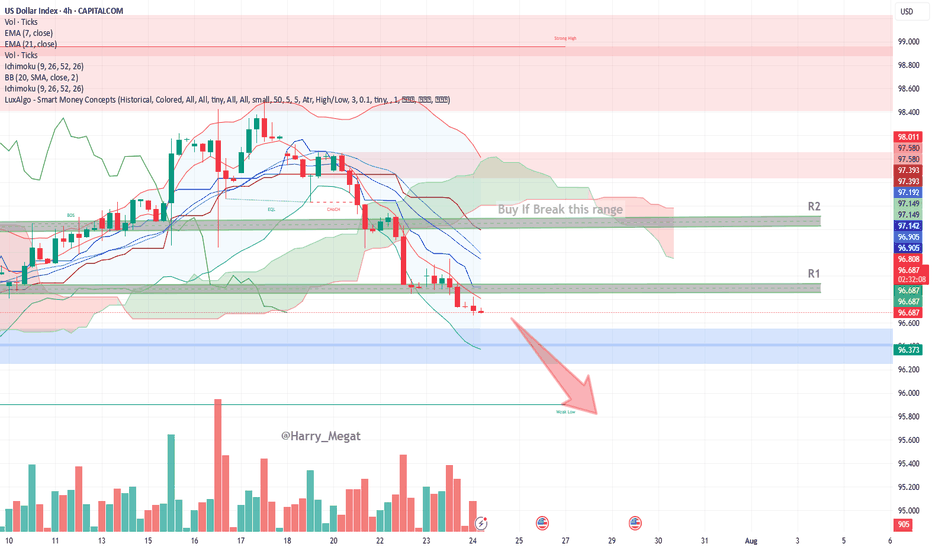
US Dollar Index (DXY) – 4H Chart Analysis **Current Trend:** Bearish Price trades below EMAs, Ichimoku Cloud, and within a bearish channel. #**Bearish Scenario (Favorable)** * **Conditions:** * Price remains below EMA 7 & 21 * Stays under Ichimoku Cloud and 96.812 resistance (R1) * Lower lows forming, bearish momentum increasing * **Confirmation:** ...
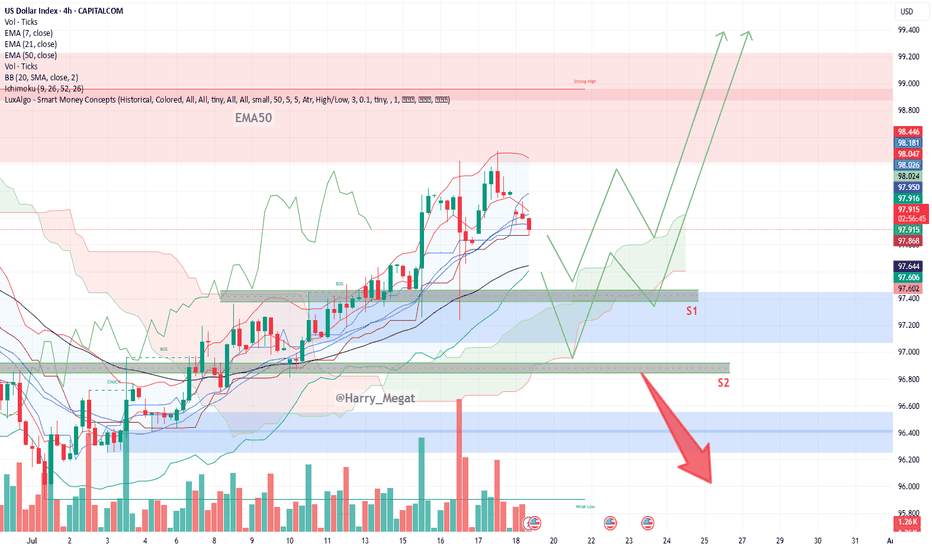
**DXY Chart Outlook: Trend, Support, and Price Objectives (Reworded Analysis)** **Trend Overview** * The DXY chart reflects a **clear upward trajectory**, characterized by a sequence of **ascending highs and higher lows** — a classic sign of bullish momentum. * Currently, the price is **retracing toward the 50-day EMA**, which appears to be holding as **dynamic...
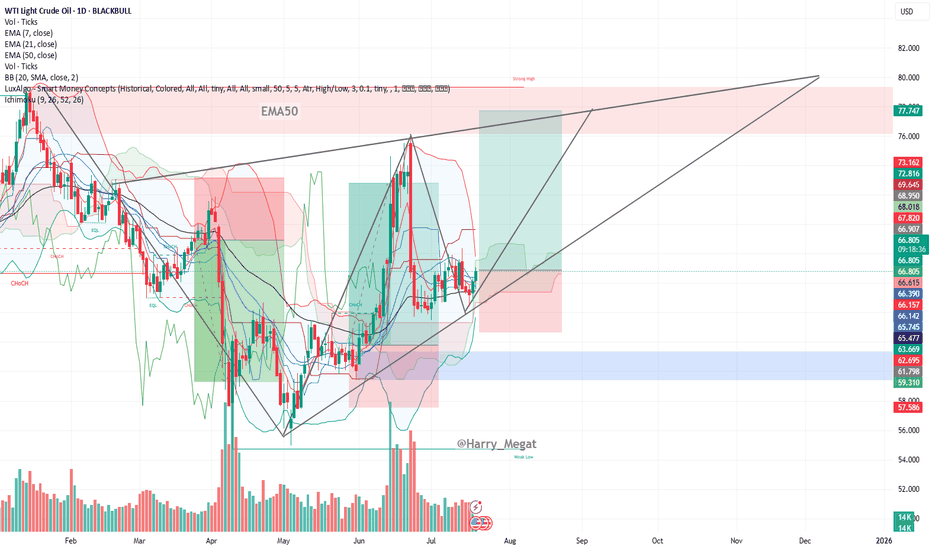
WTI Crude Oil Daily Chart Analysis **Trend & Structure:** * The chart displays a **symmetrical triangle** formation, signaling a **potential breakout setup**. * Price is currently trading around **\$66.78**, gradually rising from its recent consolidation. * **Higher lows** and **lower highs** indicate a tightening range, which usually precedes a sharp...
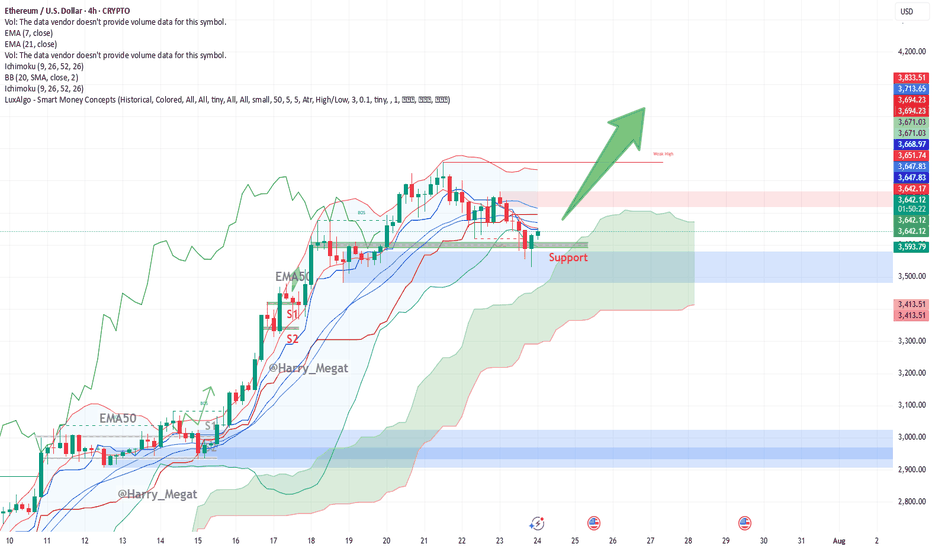
This Ethereum (ETH/USD) 4-hour chart presents a **bullish setup**. Let’s break it down: **Chart Overview:** * **Price at the time of chart:** \~\$3,650 * **Support Zone:** \~\$3,615–3,630 (highlighted in green box) * **Indicators:** * **EMA 7 (Red):** \~\$3,653.87 * **EMA 21 (Blue):** \~\$3,669.75 * **Bullish Signal:** Large upward green arrow suggests...
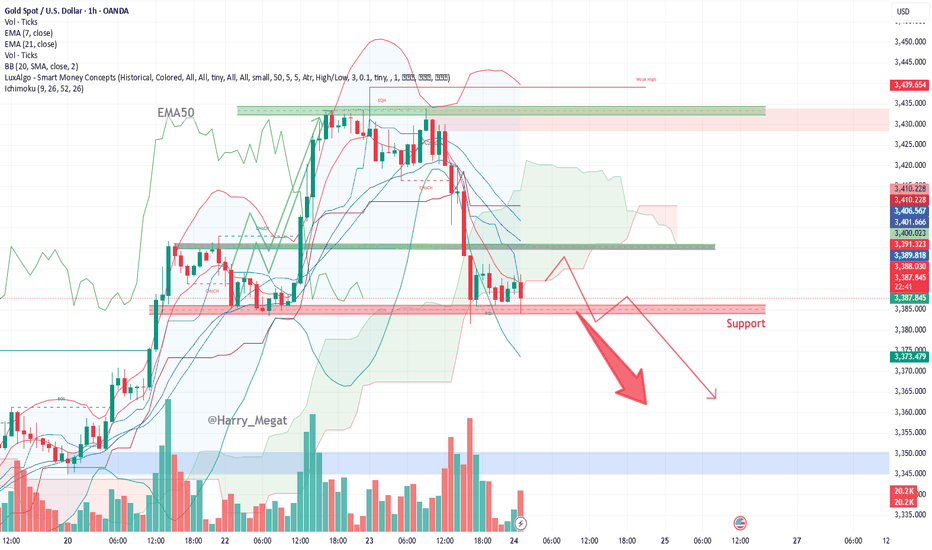
Chart Analysis Gold (XAU/USD) **Bearish Outlook (Short-Term)** * **Price is below EMA 7 and EMA 21**, showing short-term bearish momentum. * Strong **resistance zone** around **\$3,430–\$3,440** was rejected sharply. * Price has broken below **\$3,405–\$3,395** support and is now **consolidating above \$3,385–\$3,380**, a critical support area. * Volume is...
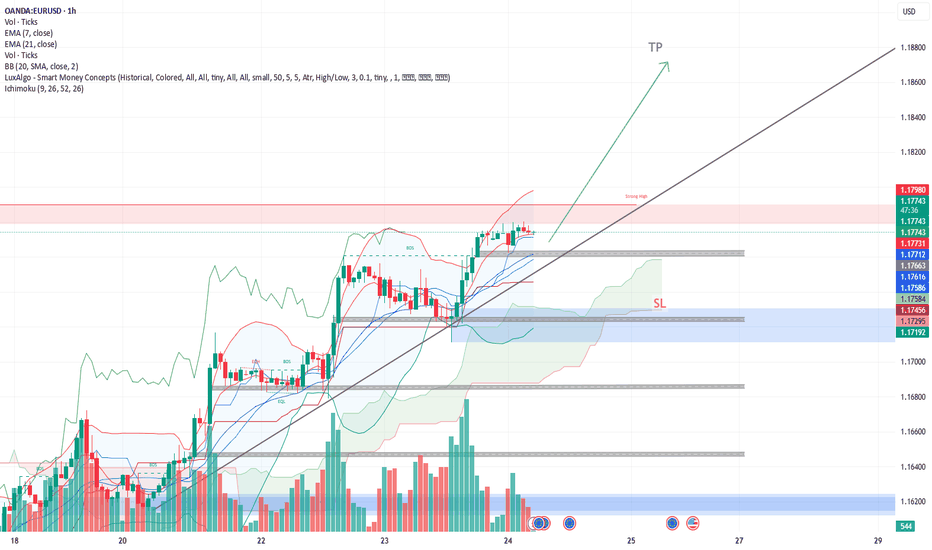
EUR/USD – Buy Setup Analysis (1H Chart) 📈 **Trend**: Uptrend The pair is respecting the ascending trendline and is trading above both the EMA 7 and EMA 21, indicating bullish momentum. **🔹 Long Setup** * **Entry:** Around 1.1774 (current price) * **Stop-Loss (SL):** 1.1731 (below trendline & EMAs) * **Take-Profit (TP):** 1.1872 (based on recent swing high) **🔎...
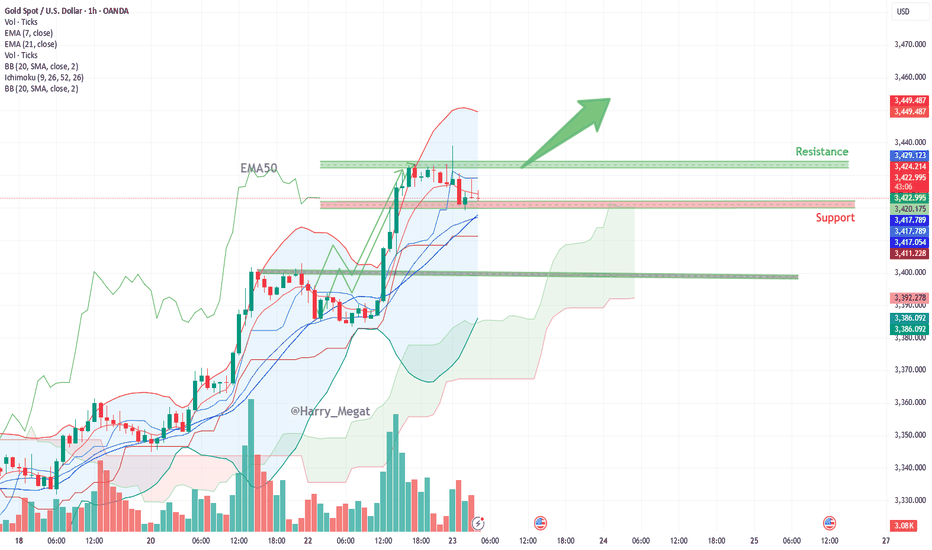
Gold Spot (XAU/USD) Chart analysis **Chart Overview** * **Current Price:** \~\$3,423.68 * **Recent Trend:** Bullish (Strong upward movement before recent consolidation) * **Timeframe:** 1-hour chart * **Indicators Used:** * EMA 7 (Blue) * EMA 21 (Purple) * Bollinger Bands (Red/Green lines) * Volume bars at bottom **Bullish Momentum Signals** 1....
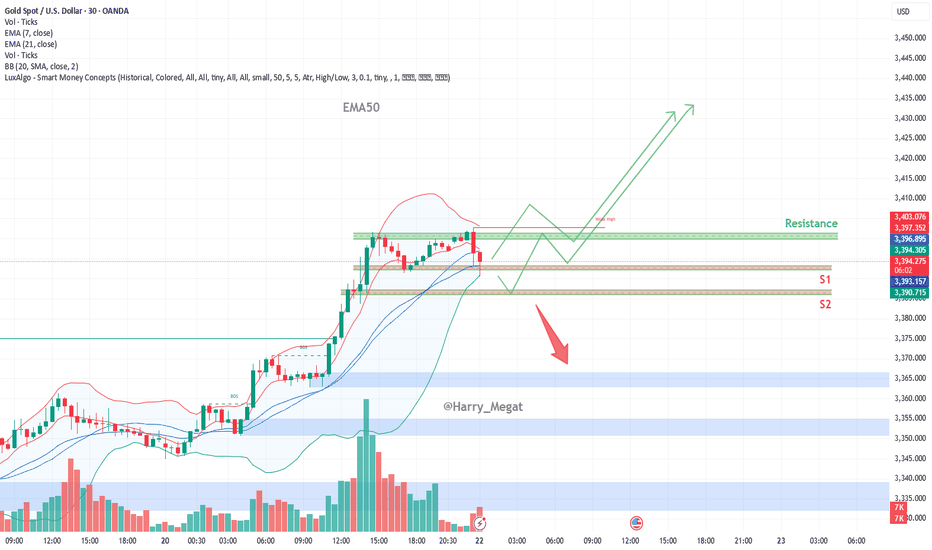
XAU/USD (Gold vs. USD) chart structure **Chart Overview** * **Current Price:** \~\$3,393 * **Indicators Used:** * EMA 7, EMA 21 (short-term momentum) * Bollinger Bands (20 SMA, 2 Std Dev) * **Support Zones:** * **S1:** \~\$3,392 – recent demand zone and confluence with EMAs * **S2:** \~\$3,380 – deeper demand zone below * **Resistance Zone:**...
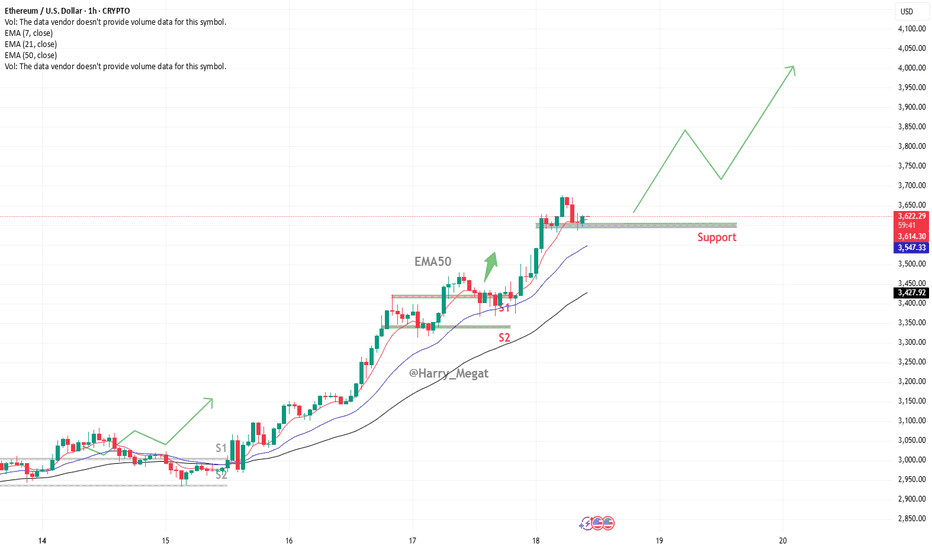
Ethereum (ETH/USD) Chart Analysis **Trend Overview:**Ethereum (ETH/USD) Chart Analysis * The chart shows **strong bullish momentum**, with Ethereum maintaining an upward trend of **higher highs and higher lows**. * The price is currently around **\$3,618**, well above the key moving averages: * **EMA(7): \$3,610** * **EMA(21): \$3,539** * **EMA(50):...
Gold (XAU/USD)**, showing a bullish outlook based on price action and support zones. **Chart Analysis:** * **Current Price:** \$3,359 * **EMA Signals:** * EMA 7: \$3,353 * EMA 21: \$3,345 * EMA 50: \$3,341 **Bullish EMA alignment** (short EMAs above long) signals upward momentum. * **Support Zones:** * **S1**: \~\$3,345 (strong short-term demand...
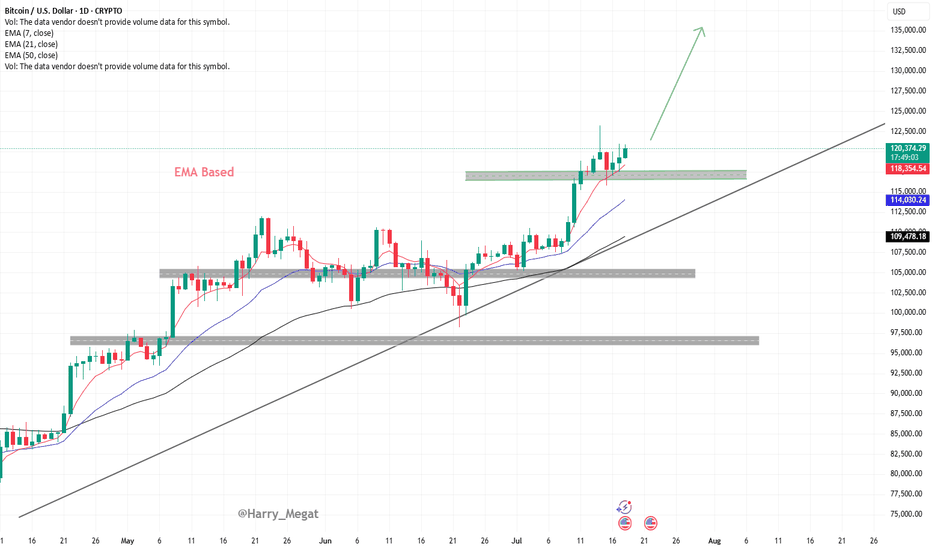
Bitcoin (BTC/USD) Technical Analysis – Daily Chart Overview This chart shows a **bullish continuation setup** for Bitcoin, supported by **EMA structure**, **trendline**, and **support zone** validation. Here's the detailed breakdown: **1. Trend & Structure** * **Uptrend:** Price is in a clear uptrend, making higher highs and higher lows. * **Trendline:** The...
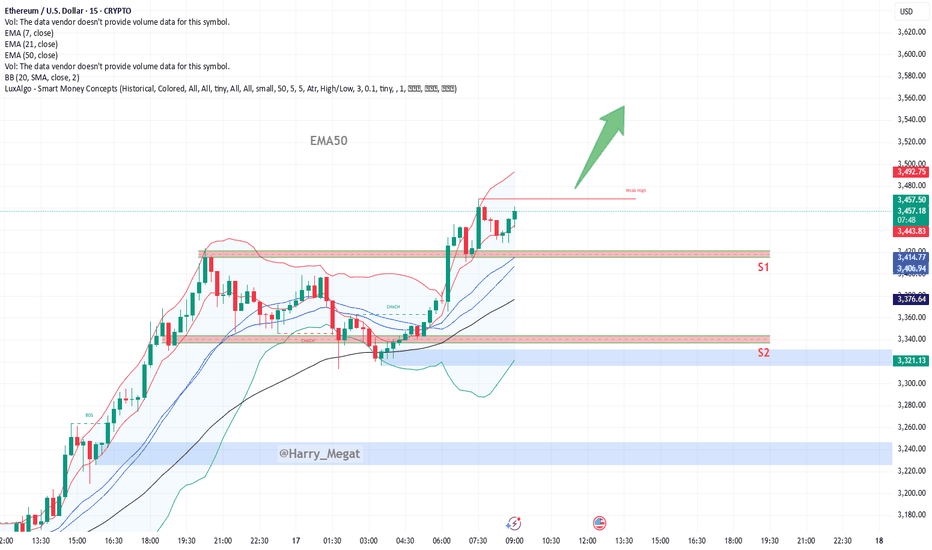
Technical **chart analysis** for **ETH/USD** based on (15-min timeframe) : Bullish Outlook** * **Price Action**: Ethereum is consolidating just above previous resistance (\~\$3,440) after a breakout from the range. * **Current Price**: \~\$3,446 * **EMA Support**: * EMA 7: \$3,441 (price holding above) * EMA 21: \$3,413 * EMA 50: \$3,376 (strong dynamic...
Gold (XAU/USD) Setup based on 30-minute chart **Bullish Scenario** * **Support Held**: Price is currently testing a key horizontal support zone (\~\$3,320–\$3,327), which has held multiple times in the past. * **Potential Reversal**: If price forms a bullish candlestick pattern here (e.g., bullish engulfing, hammer), we may see a rebound. * **Upside Target**: ...


