IngemarBurns
PremiumGold after breaking the support, now again reached the support level which will be its resistance now, will it break it or get rejected form here. Enter the long only on breakout and retest till then its bearish trend.
Bitcoin will fall further from August 8th and crypto will officially end.
BTC/USD – Historical Cycle Analysis & Mid-Term Outlook (1W) Exchange: Coinbase Timeframe: Weekly (1W) Key Observations: Long-Term Trendline Resistance The black ascending trendline has historically acted as a major resistance zone since 2017. Every touch of this line in the past has been followed by a significant correction. Bearish Divergences (DIV /...
From the price level of 3368 and above, gold is expected to pull back at least until the Stochastic on the M30–H1 timeframes reaches oversold levels. After that, a bullish continuation is likely, pushing the price up to around 3400. This area will be a critical decision point — determining whether the market will continue its uptrend or reverse into a...
Macro approach: - Gold retreated this week, reversing early gains to trade near four-week lows amid renewed US dollar strength and caution ahead of the Fed's policy decision. - The retreat was mainly pressured by stronger-than-expected US economic data and a tentative revival in risk appetite, offsetting pockets of safe-haven demand. - Key drivers included robust...
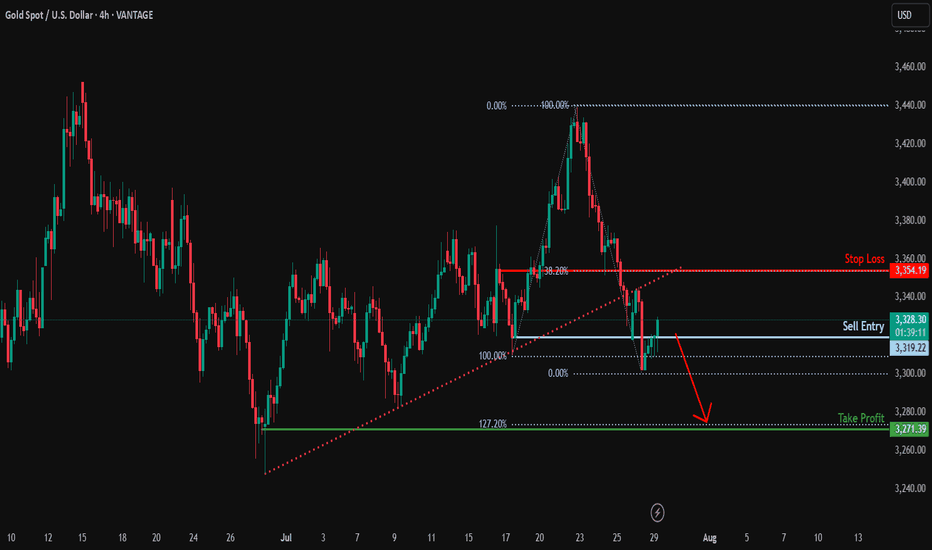
XAU/USD is rising towards the resistance level, which serves as a pullback resistance and could drop from this level to our take-profit target. Entry: 3,319.22 Why we like it: There is a pullback resistance. Stop loss: 3,354.19 Why we like it: There is a pullback resistance that aligns with the 38.2% Fibonacci retracement. Take profit: 3,271.39 Why we like...
Based on the H4 chart analysis, we can see that the price is rising toward our sell entry at 3350.10, which is a pullback resistance. Our take profit will be at 3311.79, a swing low support level. The stop loss will be placed at 3384.57, a pullback resistance.
"Hello, focusing on BTC on the 4-hour chart, the price is currently in a bullish momentum on higher time frames. However, it is showing signals indicating a potential completion of its pullback to the $110,000 zone. In my opinion, the $122,000 zone could be a good area to consider a sell position, with confirmation on the 15-minute chart. I plan to wait for this...
Gold closed last week with a strong bearish weekly candle, rejecting from the 3,440 supply zone and closing below the key Fair Value Gap at 3,360. This confirms downside pressure, especially in the context of a strengthening dollar. For this week, we may see a bullish opening early in the week toward 3,370, followed by a deeper bearish move targeting the major...
The area im looking to sell BTCUSDT.P from is a very strong resistance that would be very difficult for mr BITCOIN to pass through, so therefore, im expecting BTC to reject from there and fall to the down side. Sell BTC
Why Gold Pulled Back - Gold pulled back today after hitting $3439.04, just below resistance at $3451.53. Traders took profits ahead of key Fed and trade headlines. Right now, it’s trading around $3414.48, down 0.50%. - The dip came after the U.S.-Japan trade deal eased geopolitical tension, cutting safe-haven demand. Plus, U.S. bond yields are climbing (10-year...


