✅ TCB Strategy Analysis Trend Phase HTF Bias: Recently shifted from bearish to potential bullish — clear breakout from descending channel. Current Structure: Price has broken above channel and retested former structure resistance (~3325) as support. Bias: Bullish continuation forming. 🚨 XAUUSD – TCB Strategy Setup (EP1 Active, EP2 Pending) 💥 Price just broke...
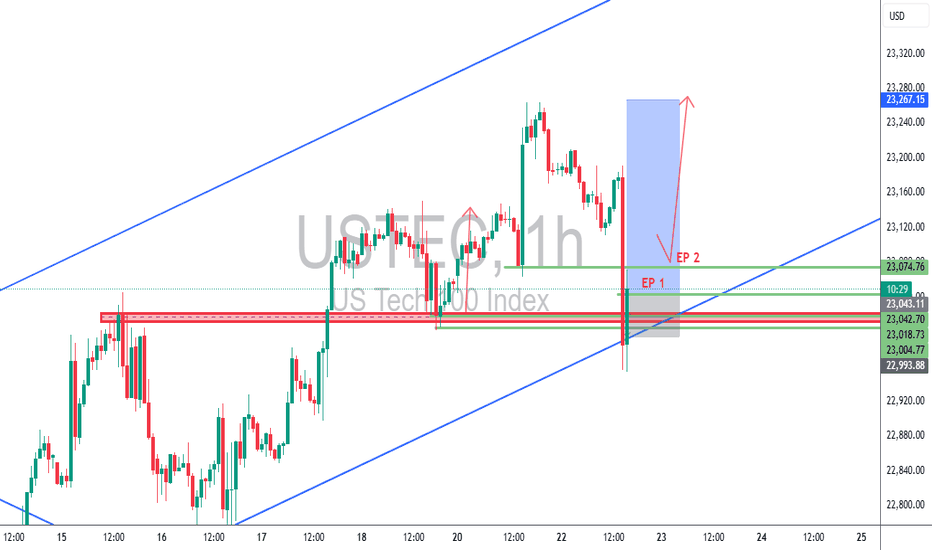
USTEC 1H – Dual Entry Precision | TCB Trend Phase Setup Market remained bullish with clear channel structure. After a pullback into the previous breakout zone, price swept liquidity and wicked below, offering two refined entries (EP 1 & EP 2) inside the demand zone. 🔸 EP 1 – Aggressive entry on first touch 🔸 EP 2 – Confirmation entry after rejection 🔸 SL placed...
📈 GBPJPY 4H – A+ Setup Using TCB Strategy 🔥 Bullish continuation setup unfolding with precision. ✅ Trend Phase: Higher highs and higher lows confirm uptrend Price bounced from ascending trendline and demand zone EP1 already triggered on bullish rejection from key support ✅ Countertrend Phase: Falling wedge (countertrend channel) broken to the upside Early...
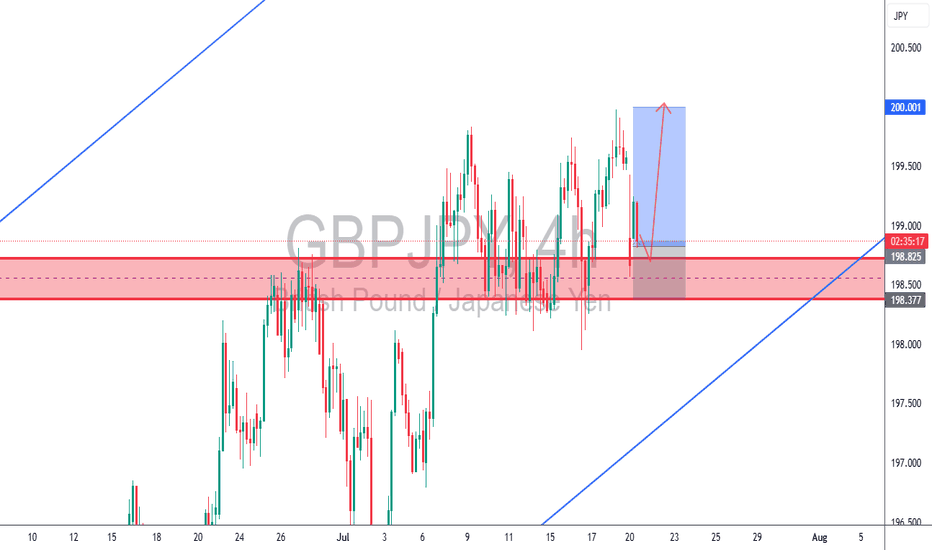
🏹 GBPJPY 4H – Demand Zone Rejection | Bullish Continuation GBPJPY tapped into a key 4H demand zone with a strong rejection wick, respecting both horizontal support and trendline structure. With bullish momentum building, price is likely to push toward the psychological 200.000 level. ✅ Demand zone + trendline confluence ✅ Bullish rejection after liquidity sweep ✅...
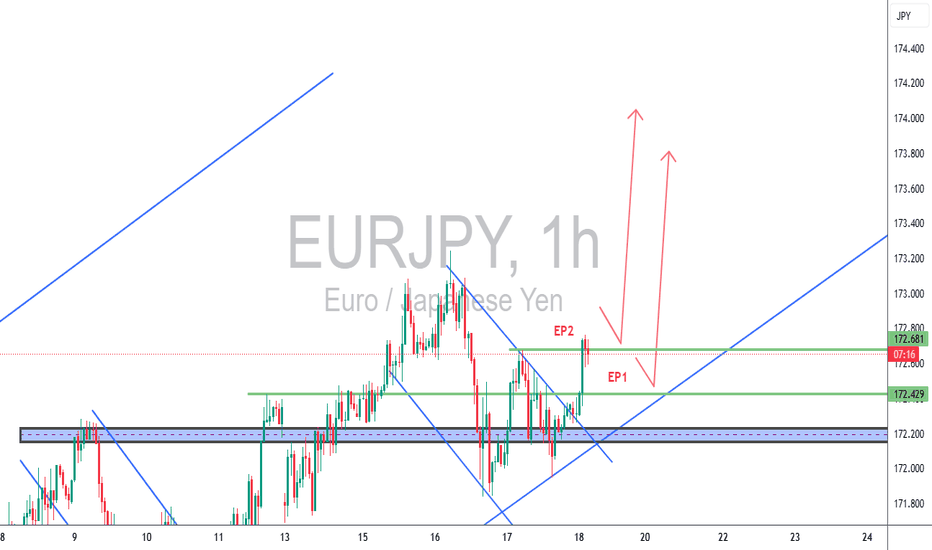
🕐 EURJPY – TCB Setup (Higher Timeframe Validation ✅) Strategy: Trend → Countertrend → Breakout (TCB) Timeframe: 1H Status: Breakout confirmed — now watching EP1/EP2 for clean entry signals 🔍 Setup Breakdown: 📈 Trend: Clean bullish channel structure still intact ↘️ Countertrend: Descending wedge fully broken to the upside 🚀 Breakout: Price is now testing key...
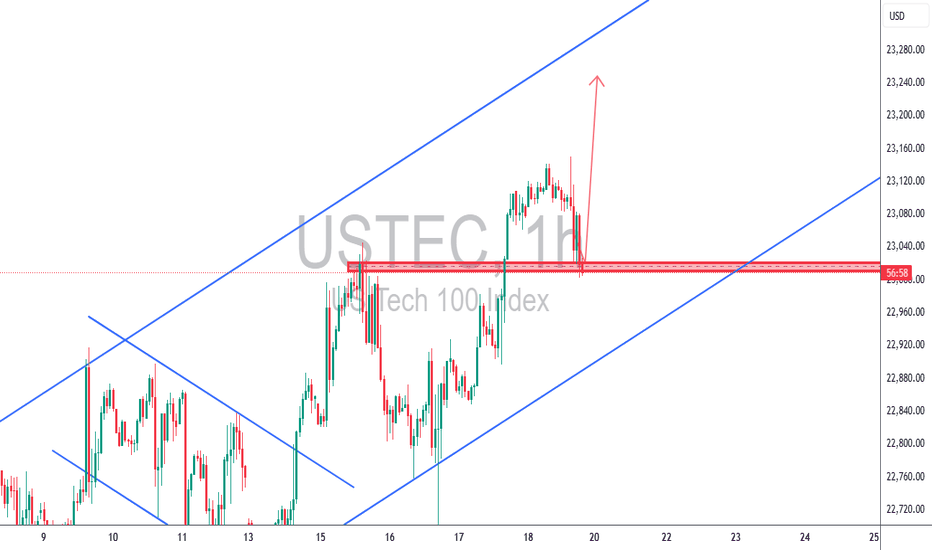
🔥 USTEC 1H – Bullish Continuation Play Price pulled back into a strong demand zone and ascending channel support. We're in a clear bullish trend, and this retest offers a high-probability continuation setup. ✅ Demand zone confluence ✅ Previous resistance turned support ✅ Trendline + bullish wick rejection ✅ Clean structure with 1:3+ potential 🎯 Targeting 23,250+...
📈 XAUUSD – TCB Setup (Pre-Breakout Watchlist) Strategy: Trend → Countertrend → Breakout (TCB) Timeframe: 15-Min Status: Pre-breakout — watching for NY session confirmation 🔍 🔍 Setup Breakdown: ✅ Trend: Bullish channel structure holding above 3,310 ⚠️ Countertrend: Pullback to demand zone (3,330–3,332) respected 🚀 Breakout: Watching key breakout above 3,348 for...
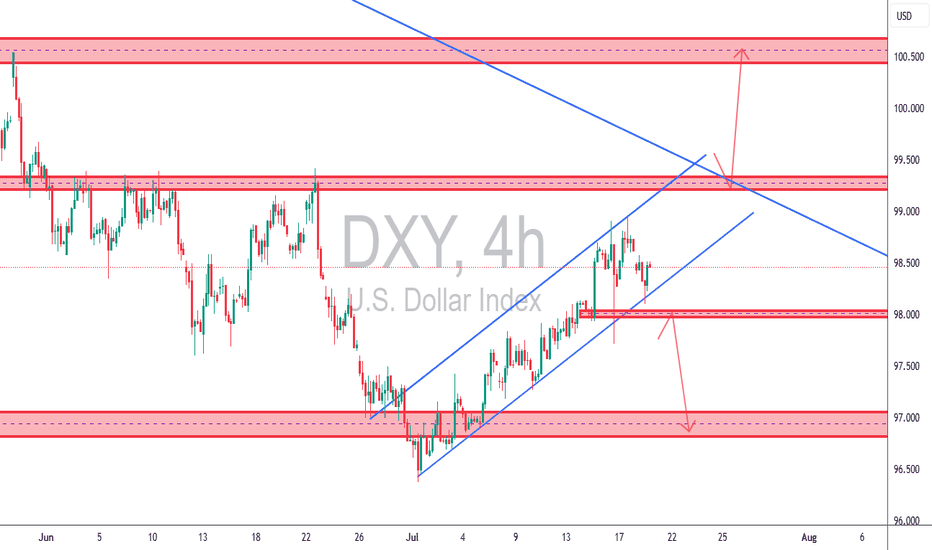
✅ TCB Strategy Application on DXY 4H 🔹 Trend → Countertrend → Breakout Structure: • Trend: We’ve had a bullish recovery from the 97.00 zone (bottom demand), moving within an ascending channel. • Countertrend Zone: Price has now pulled back from the 99.00–99.200 supply area. • Breakout Watch: o A break below the ascending channel (support line) + 98.00 zone would...
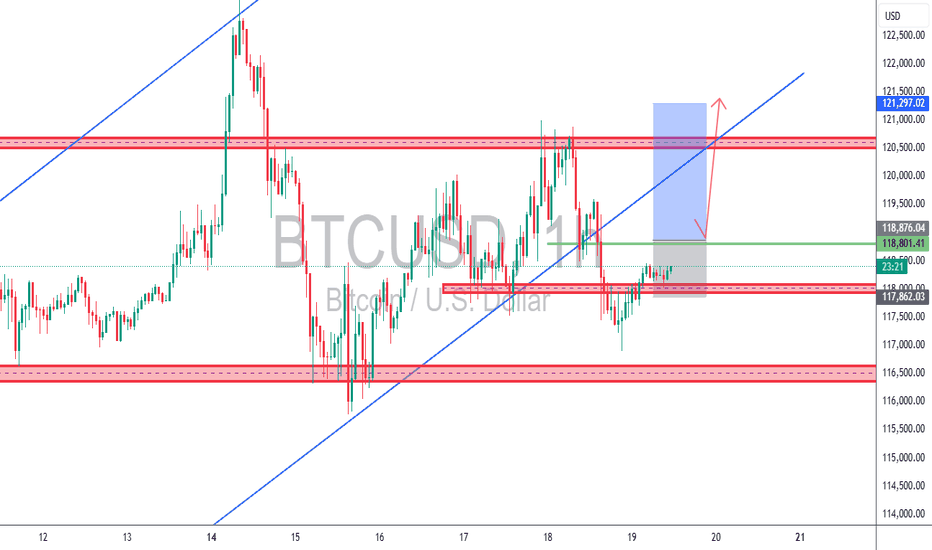
📌 BTCUSD 1H – TCB Breakout Reclaim Setup 📆 Date: July 19, 2025 🔍 Strategy: TCB (Trend–Countertrend–Breakout) 🧠 Context: BTCUSD broke below an ascending channel, found support at ~118,000, and is now attempting a reclaim of previous structure. This is a classic reclaim zone setup — where a clean retest of prior support-turned-resistance turns back into support...
This is a classic textbook-quality TCB setup forming right at a critical confluence zone. Here's a full breakdown from a trader's lens: 🔵 1. Trend Bias: Bullish The macro structure from June shows a strong uptrend, and the most recent impulse was explosive — indicating active buyers. H4 and D1 show no trend break yet. 🔵 2. Countertrend The descending channel...
📈 XAUUSD 1H – Bullish Trend Continuation Setup (TCB Trend Phase) Timeframe: 1H Strategy Phase: ✅ Trend Phase (Pullback & Breakout) 🔍 Analysis: Gold (XAUUSD) continues to hold its bullish trend structure, with price breaking above the descending trendline and forming higher highs and higher lows. After a recent breakout, price pulled back to a key support +...
EURJPY – Breakout Retest Trade | TCB Strategy Execution 📍 Pair: EURJPY 🕒 Timeframe: 4H 📅 Date: July 13, 2025 📈 Strategy: TCBFlow (Trend → Countertrend → Breakout) 🔹 Market Context: EURJPY is maintaining bullish structure within a rising trend channel. After a corrective dip, price has reclaimed structure above 171.550–171.640 and broken above resistance with...
📉📈 USDCAD 4H – Compression at Resistance | Breakout or Rejection? Price is consolidating near a major supply zone inside a wedge structure. We're at a key decision point: a clean breakout above 1.3750 = bullish continuation; a rejection and break of minor trendline support = bearish drop back to demand. 🧠 TCB Strategy in play: waiting for breakout confirmation or...
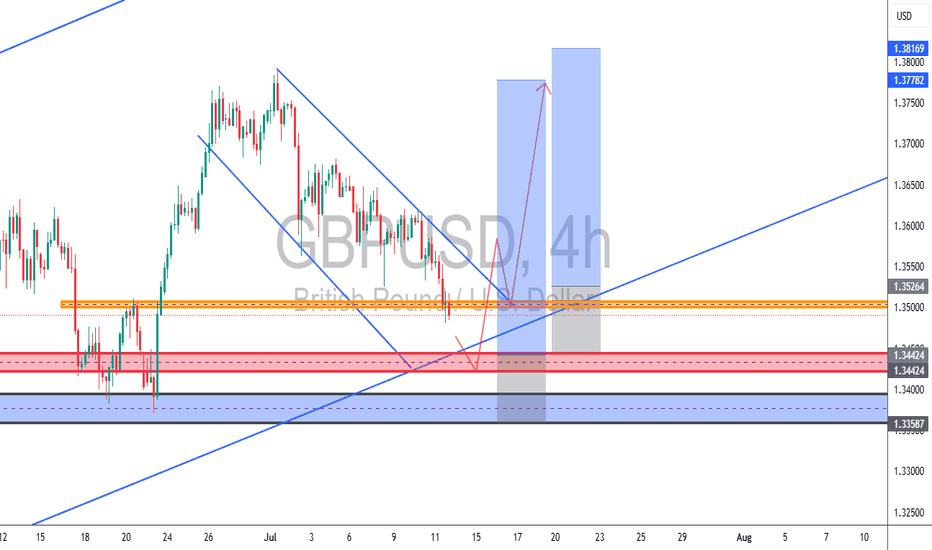
📈 GBPUSD – Countertrend Wedge Setup Near Key Demand (TCB Strategy Setup in Progress) Timeframe: 4H Strategy Phase: ✅ Countertrend Phase (Falling Wedge + Liquidity Sweep Potential) 🔍 Analysis: GBPUSD is currently forming a falling wedge correction within a higher-timeframe bullish trend. Price is approaching a major confluence zone between 1.3442 and 1.3358,...
🔍 Technical Overview: Trend: Price has clearly broken below the rising channel. Retest Zone: The grey box shows a bearish retest zone at 3,315–3,310, which price tapped before rejecting. Current Support: Price is reacting at the 3,300 horizontal level (former demand zone). Target Area: The blue box points to a possible TP zone around 3,263, aligned with...
US30 – Bullish Breakout Retest Play (1H + 15M Confluence) Price has broken out of descending channel and is now retesting the 44,671–723 zone. 1H chart confirms bullish momentum within a broader uptrend. Watching for clean retest → continuation move towards 44,850+. Checklist Score: ✅ 9/10. #US30 #DowJones #TCBstrategy #BreakoutRetest #SmartMoney...
📈 BTCUSD – Bullish Breakout from Falling Wedge (TCB Strategy A+ Setup) Timeframe: 1H Strategy Phase: ✅ Countertrend Phase (bullish breakout) 🔍 Analysis: BTCUSD formed a well-defined falling wedge (countertrend structure) during a bullish market environment. After a clean liquidity sweep of the wedge lows and several failed breakdowns, price broke out with strong...
🔍 Technical Overview: Current Price: Around $3,349.68 Breakout Zone: Price has broken above a descending trendline and is retesting the $3,345–$3,350 area (key structure + previous resistance). Target Zone: Marked with a blue box and arrow near $3,385–$3,390, indicating the bullish target. Entry Signal (Implied): Price broke and retested the upper trendline →...


