King_BennyBag
EssentialBitcoin CME Futures is currently trading inside a falling wedge on the 4H timeframe. We’re sitting at a key decision point, with liquidity both above and below. Volume profile shows strong resistance, with a large high-volume node. Support has held, with a clean rejection and demand showing up. Fair Value Gaps (FVGs) are left above and below acting as magnet...
What is Trading the Trend? Trading the trend means buying when the market is going up, and selling when it’s going down. You're following the direction of the market, not fighting it. If the trend is up: Price makes higher highs and higher lows You look for chances to buy (go long) If the trend is down: Price makes lower highs and lower lows You look for...
Support and resistance are key concepts in technical analysis that help traders identify where price is likely to react. Support acts like a floor — a level where buying interest is strong enough to prevent further declines. Resistance acts like a ceiling — a level where selling pressure can stop price from rising. These zones often lead to bounces,...
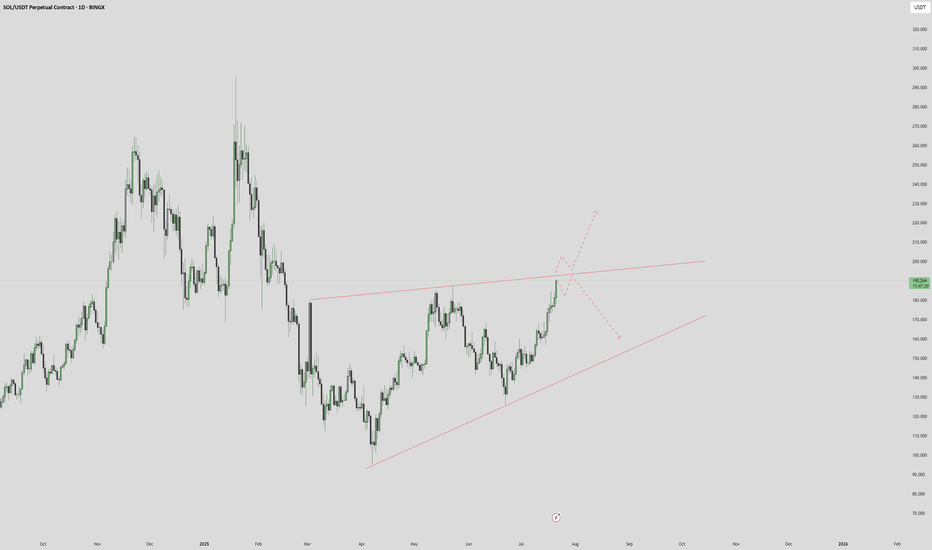
We can see a wedge is forming, price is at a major point, break above with a failed break below the resistance - we see high potential for $250. Failed breakthroughs and a rejection? We see $150 once more. Thoughts?
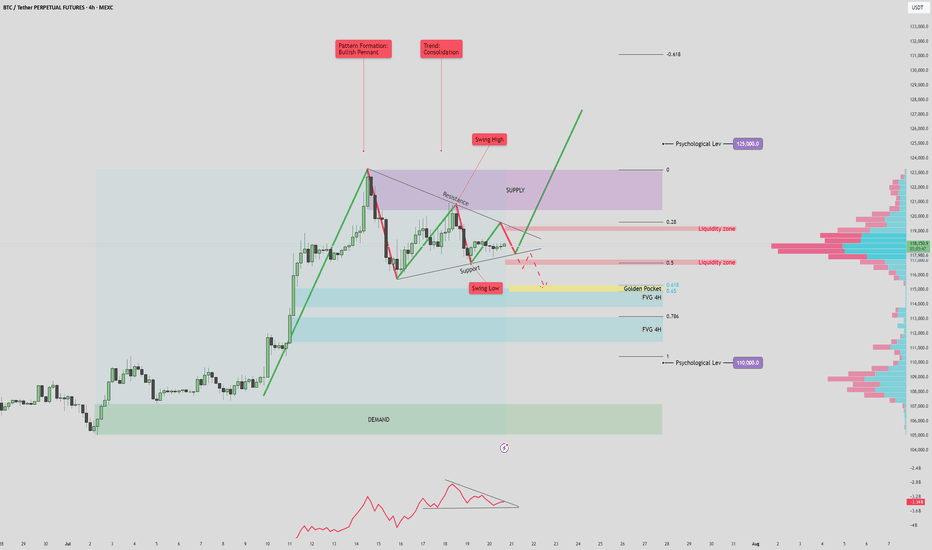
BTC/USDT 4H Analysis – July 20, 2025 The current market structure shows a bullish pennant forming after a strong impulsive move upward, with price consolidating between key support and resistance levels. This pattern, combined with volume signals and key price zones, suggests a potential for a high-volatility breakout. 🔷 Volume Profile & OBV Insights The...
BTC/USDT – 4H Chart Technical Analysis Market Structure & Trend Overall Trend : Bearish (clearly defined by a consistent downtrend channel). Current Structure : Price is in a corrective downtrend within a descending channel, after multiple rejections from the supply zone. Key Technical Zones 1. Supply Zone Strong rejection zone where the price...
Solana (SOL/USDT) – 4H Market Outlook | July 1, 2025 Introduction SOL has formed a reverse head and shoulders pattern, followed by a clean breakout above resistance. While the lower time frame is bullish, the higher time frame remains bearish, creating a short-term opportunity within a broader downtrend. Context 1: Key Zones Supply Zone: 176 – 187 Demand...
BTC/USDT (1D) Market Outlook – July 1, 2025 Introduction BTC is currently consolidating within a bullish flag pattern after printing a swing high at 108.9K and a recent swing low at 98K. The price sits just below a major supply zone. Context 1: Key Zones Supply: 104.6K – 112.1K Demand: 74.4K – 82.5K Fair Value Gaps (FVG): 3 zones below price, with one...
🔎 STRUCTURE & TECHNICAL ELEMENTS 1. Pattern: A falling wedge was formed and broken cleanly to the upside → bullish reversal structure. Breakout was followed by a successful retest at prior structure lows (marked “Clear Breakout and Retest”). 2. Fair Value Gap (FVG 1D) Zone: Currently being tested. This zone coincides with: Minor support from prior...
🧠 High Time Frame Context Trend: Consolidation within a broad range (support and resistance clearly defined). Key Psychological Levels: 105,000 USDT – minor level, acting as a magnet in short-term PA. 110,000 USDT – major supply confluence and liquidity target. 🟪 Supply & Resistance Zone Zone: Marked in purple (108.5k-112k). Key Observation: ...
🔍 HYPE/USDT Technical Analysis (4H Chart) High Time Frame (Daily): Bullish Despite recent pullbacks, the overall trend remains bullish on the daily timeframe. However, current price action suggests a potential fakeout or legitimate breakdown, as we test key structural and volume-based supports. Short-Term Time Frame (4H): Bearish The 4-hour chart...
Gold Spot (XAU/USD) – 1H Chart: Chart Overview: Overall Market Context: Gold is currently retracing after a strong downtrend from a swing high near the supply zone. Price is reacting near a key bullish trend line and a local swing low. Key Technical Elements: OBV (On-Balance Volume): The OBV has broken out of its downtrend resistance, suggesting a...
📊 1. Trend Analysis HTF (Higher Time Frame) Bullish: Long-term trendline shows sustained upside momentum with 3 clean touches, indicating trend strength. LTF (Lower Time Frame) Bearish: Short-term structure broke down from the trendline but is now showing signs of reversal with a falling wedge breakout. 📈 2. Chart Pattern Falling Wedge: Classic bullish reversal...
SOL/USDT – 4H Chart Summary Market Structure: HTF: Bullish trend remains intact. LTF: Previously bearish, now showing early signs of a bullish reversal. Pattern Formation: Potential Inverse Head & Shoulders forming. Neckline at $157 — must hold for pattern to complete. Break above previous high will invalidate Inverse Head & Shoulders. Trendline &...
FET/USDT – 4H Time Frame Analysis Pattern Formation: A rounding top is clearly visible, suggesting weakening bullish momentum and potential trend reversal. Trend Structure: Price is forming lower highs and lower lows, confirming a bearish trend. Key Zones: Supply Zone: $0.85 – $0.975 Demand Zone: $0.35 – $0.45 Neckline Support: Price is approaching a...
CRYPTOCAP:ETH / USDT – 4H Time Frame Analysis Structure: Bullish Flag | Outlook: Neutral-Bullish | Target: $3000? 🔹 Chart Overview -Pattern: Bullish Flag (continuation structure) Current Range: - Supply Zone: $2,680.00 – $2,786.21 - Demand Zone: $2,319.79 – $2,417.61 Price Action: - Tight consolidation between higher lows and lower highs, forming a...
Structure & Zones Price is trading between a clear supply zone above and a demand zone below, offering defined areas for reaction. Two unfilled FVGs on the 1D timeframe above current price could act as magnet zones for price continuation. A 4H FVG just beneath current price is nearly filled — potential area for a bullish bounce. Three psychological price levels...
OP/USDT – 4H Chart Summary Market Structure: 4H Timeframe: - Price consolidating within a descending triangle/wedge pattern, indicating potential buildup before a breakout. - Lower Timeframes (1H and below): Bearish trend structure with lower highs and lows. - OBV (On-Balance Volume): Forming a wedge—suggesting accumulation or distribution phase nearing a...


