MastaCrypta
PremiumIMX Looks like a structure is broken for everyone to watch, but the stances is as shown below!!!!!! We can see that the price was building value comfortably above $0.63–$0.65 until May 2nd. Then, a strong selling move broke below that range, followed by a new value area formation below $0.59, showing that sellers are in control and the market is accepting these...
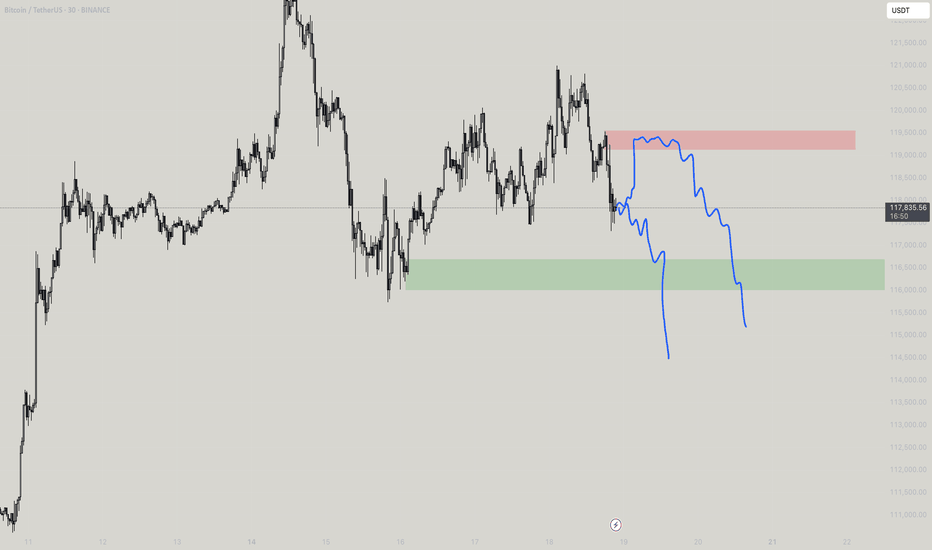
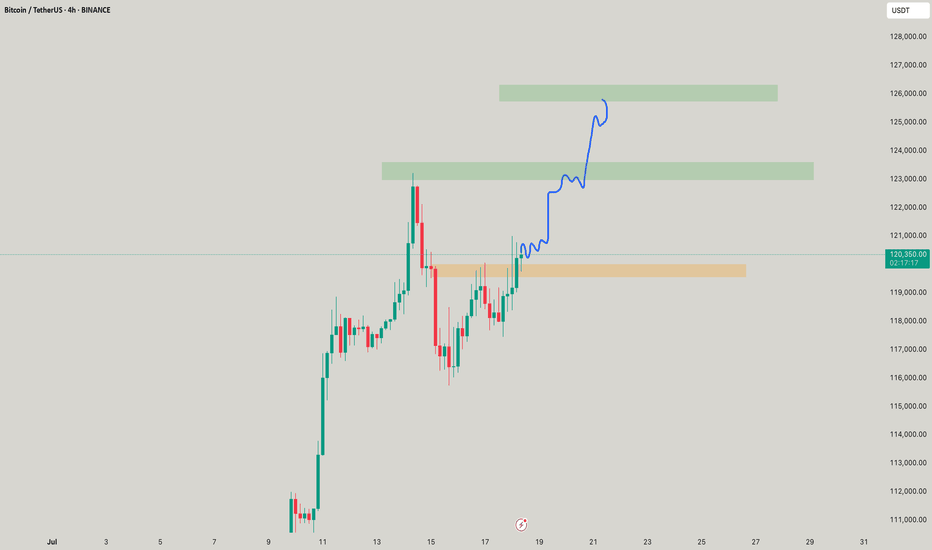
BTC as mentioned, have a slingshot move as mentioned above and shall come to the SVP 95,010, where can move up again
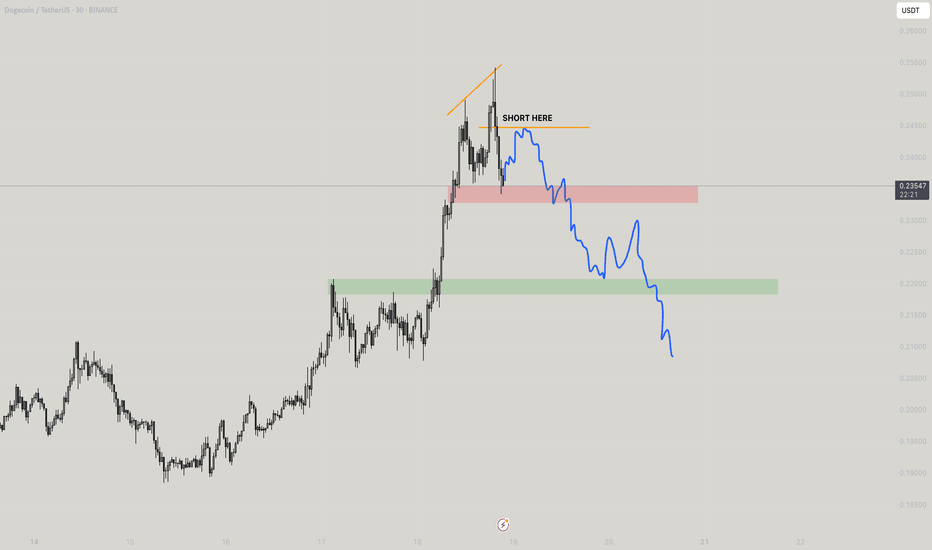
HEYYY Fart is back!! I have attached my recent mega fart pattern which would be able to be relocated at the bottom of this page! Look at this it - it shows a notable slowdown and rotation phase after a strong move. From the left of the chart, price had a bullish breakout around April 27–28, with a large session where VAH and POC shifted up aggressively and...
Helllooo and welcome!! - Look at this This is a 4H SVP chart for Cardano, The price is currently around $0.7078, and the recent structure shows a consolidation phase. The POCs (Point of Control) are clustering between $0.70 and $0.71, which means this is where the most trading volume is happening – a fair value area. Price is being accepted here. We also...
Okay so as mentioned bTC tested its nPoC 95.1k and soon would come off to 90,740 as the median point where major liquidity stays, the plays are to played on the falls!
SO previously if you have seen me analyzing fartcoin, its on this basis that all OB works in place so well, So would decipher it better. Also you can see my old posts to get a conclusion on whats to be done. Coming to the Market Profile - we can see that the market has built a solid volume base around the $1.08–$1.11 zone, with multiple POCs (Point of Control)...
Well am late but on demand posted this, looks seriously dope at this point of time where preecedence is marked!
The move of alpaca where the whole fall trend is moved by a flag which aint a flag offc would be like this as mentioned on top.
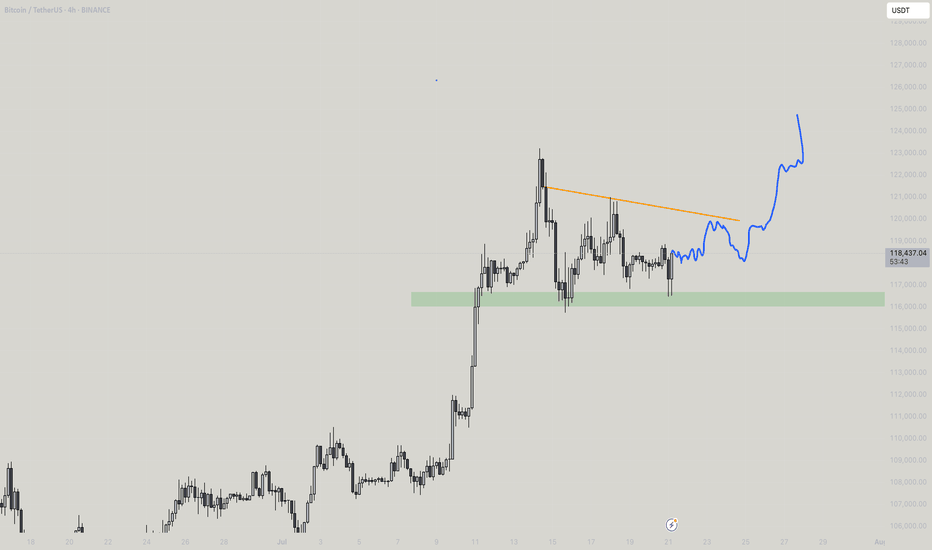
This is 12H and based on pure pattern, Normally this pattern is made bullish where it would touch up, but while the market is moving, its shaking both the shorts and up-s liquidity, which means BTC would try to defy the pattern by rolling it dowm, remember when this type is made on big coins, it takes and falls down, however its based pure on PA
The immediate structure shows aggressive selling pressure — big thin volume zones (where there is less historical volume) are visible between $93,200 and $92,700. If BTC cannot reclaim and close strongly back above $93,900–$94,100 (preferably closing inside the old VA), the path of least resistance remains downward toward $92,500 first and even $91,700–$91,500...
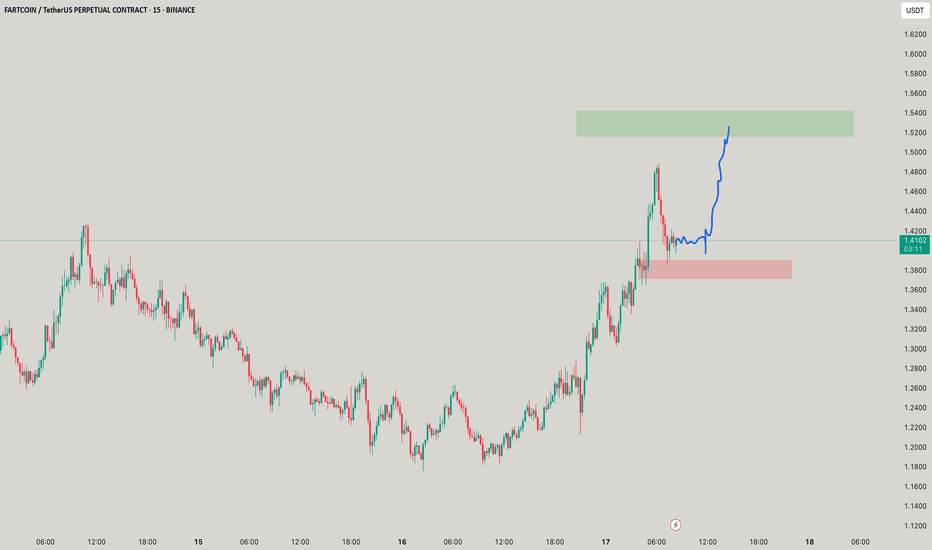
Fartcoin is on critical 4H OB, owing to the moves earlier, it shall move in the way drawn,
Bitcoin (BTC/USDT) is currently showing strong price acceptance above the $94,500 region, with the latest POC (Point of Control) holding firm at $94,880, suggesting this is the price where most trading volume has occurred recently. The VAH (Value Area High) sits just above at $95,100, and price is hovering slightly above that range at $95,043, which is an early...
TRUMP looks like a typical dead cat bounce, acquiring major short squeeze getting bonked and probably a dead cat bounce. Plan at 18.21
Not now, wait for a fall and then whoooop whooop up!!
SMOL SCALPS for SOL you to judge how it gonna work! Its just a nPoC grav pull!
Yeah looks legit to go till 92.6k but nowhere the pull is extraordinary pull, why not 83.2k? Just saying
I wont suggest fartcoin now but to those who hold the coin they may trail to book profits. Parabolic move commenced, means either it gets hold of the blue box making 4 stages before a fall, or might reverse from the last green box as said. The yellow is what if the last green box gets in place
Alright guys, I’ve been getting this a lot — ‘What’s up with Nifty 50- Though am a pure crypto guy but onto the request i would analyse the index, and i feel its very bullish! And i searched some problem is there if someone analyse it - Its just a educational chart!! So the alleged doesnt disturb me lol. This is a market profile After a sharp correction...