MoNi_MoN
PlusXRP is ready for takeoff. On the 6W chart, a low was created at $1.61. Price broke above $3.39 and is moving back toward the 2025 high at $3.66. I don’t think people are ready for what’s about to happen. XRP has always been the token that outperformed Bitcoin — yet it’s still nowhere near Bitcoin’s price… for now. I remember years ago, Jimmy Vallee from Valhil...
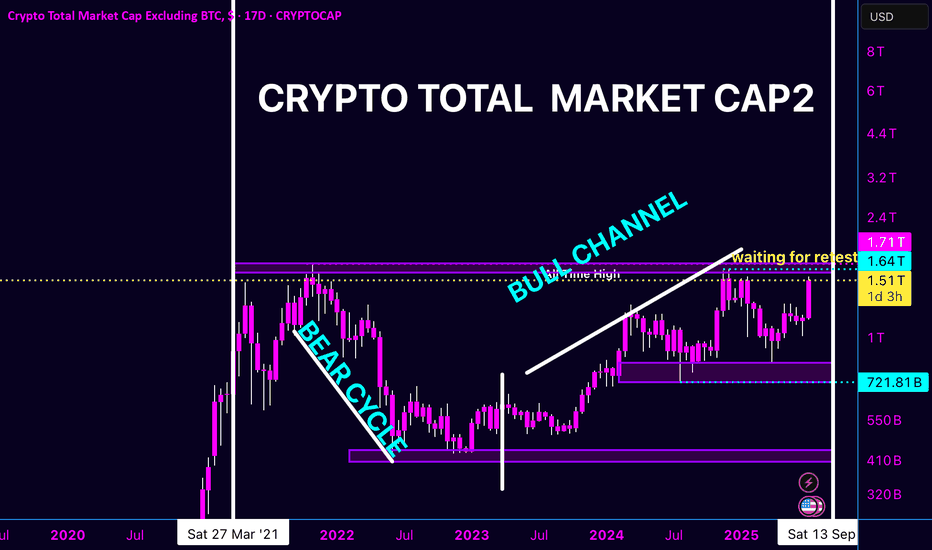
We’ve officially climbed out of the bear cycle, and after months of chop and consolidation, we’re fully engaged in the bull channel. Just tagged 1.51T again with clear intent to break into new highs. 🔹 All-Time High Zone: 1.64T – 1.71T 🔹 Current Status: Waiting for retest after bullish breakout structure 🔹 Support Levels: 830B – 950B consolidation zone 🔹...
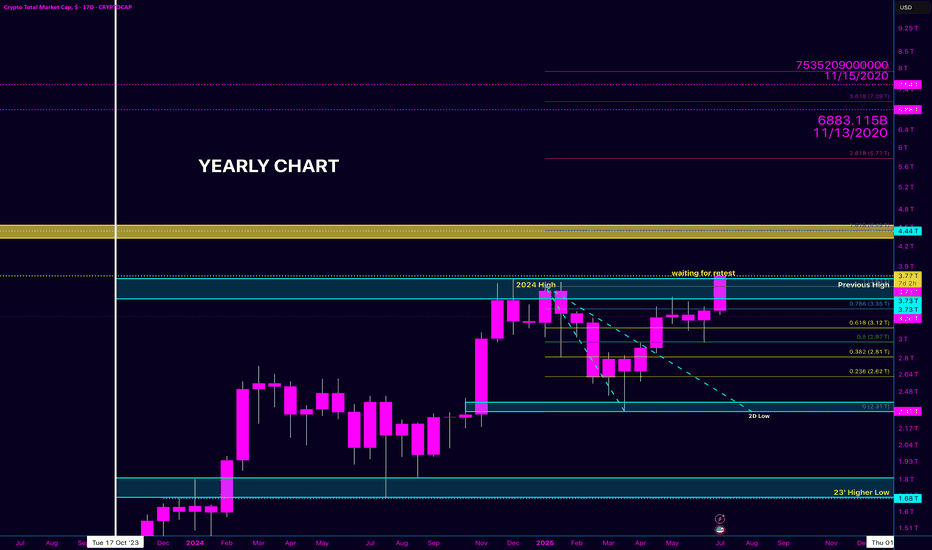
We’ve officially tapped into the previous high zone that hasn’t been touched since 2017–2020 levels. This isn’t just another bullish candle — this is macro structure reawakening. 📊 Chart Context: We’ve cleared the 2024 high. Price has pushed into a long-standing resistance block, previously a ceiling during the last crypto cycle. Now holding above key...
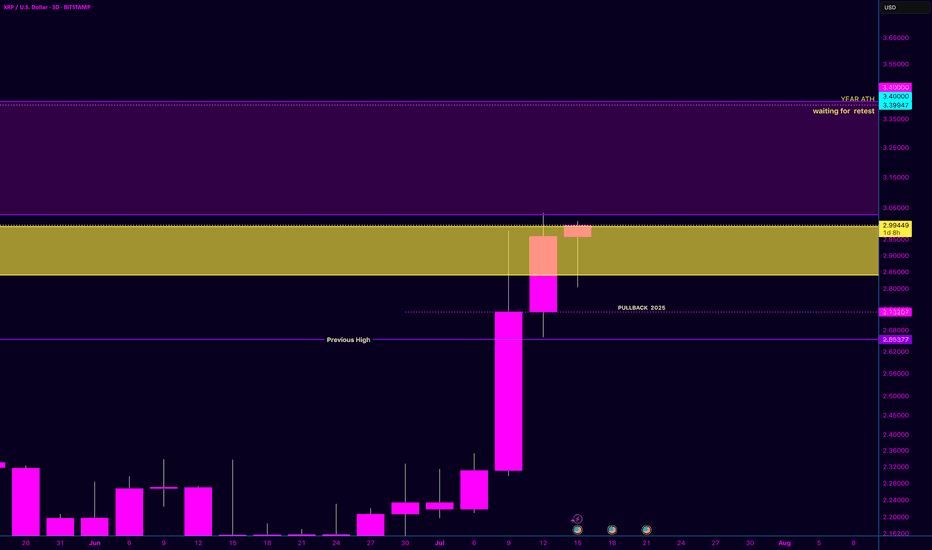
Right now, XRP is sitting at $2.99. But once it reclaims and surpasses that $3.84 level, we’ll officially be in uncharted territory. Some people say XRP is going to $100... others say $525... and there are even calls for $10K. All I know is this: once XRP prints a true higher high, the chart’s going parabolic. And I truly believe a lot of the Bitcoin maxis who...
After reviewing the 12M, 2M, and currency indexes — this isn’t just a bounce, it’s a potential macro reversal. EUR/USD (2M Chart) We’ve now got two Morning Star Dojis followed by a bullish engulfing — price is climbing steadily toward 1.16319 (neckline zone). If we break and retest clean, 1.25560 becomes a high-probability target. I view this as the neckline of a...
As of today, I’m maintaining a bullish stance on EUR/USD going into mid-2025. Back on May 22, I marked the support zone around 1.10649, and since then price action has respected that zone beautifully, forming higher lows and gaining steady upside momentum. Looking at current structure across the 11H, 20H, and 16D timeframes, I do not see any strong bearish...
I’ve been watching TOTAL closely, and we’re currently sitting right inside a pullback zone between $2.9T and $3.12T — a critical psychological area to monitor. ✅ On the 2-month chart, structure still holds strong. Price action remains bullish overall, with higher lows continuing to form. This zone looks like a healthy pullback rather than a breakdown. ⚠️...
Current Setup PARA has recently cleared weekly resistance around $6.60, with the latest candle closing just above that level. This breakout comes from a multi-year consolidation range between ~$3.75 (lows) and ~$11 (prior highs). On the weekly chart, price action shows strong momentum and a clean break above the consolidation ceiling. Fundamental Context In...
Bitcoin is showing signs of strength as price climbs back toward the mid-zone of $105K+ after a healthy pullback. Looking across the multi-timeframe setup (5M, 20H, 12M), there are several key observations that may suggest the next leg up is brewing. 🧠 Structure Breakdown: 🔹 20H Chart We're seeing a potential retest forming after the recent bounce off the 0.786...
Gold isn’t slowing down. Based on this structure, a retest at $3,500 looks inevitable. The Fibonacci levels line up, and current momentum shows strong continuation above the 0.618 zone. People keep saying Bitcoin is digital gold—but ironically, gold is outpacing the “digital coin” in real-time. These are wild times to be alive. 📈💰 Don’t sleep on real...
🔍 XRP/USD – 12M Macro Outlook Currently, my primary focus remains on the 12-month (12M) chart, which provides the cleanest view of macro structure. From a technical standpoint, we are witnessing what appears to be a mid-cycle pullback within a broader bullish continuation. 📉 While it's theoretically possible for XRP to revisit the $2.00 level or lower, support...
It found solid support around 1.10649, and now we’re simply waiting on a retest and breakout toward the next key levels: 1.15729 to 1.16921. This is exactly why I emphasize the importance of analyzing multiple timeframes simultaneously. Too many traders rely on a single screen and flip between timeframes — often missing the bigger picture. The higher timeframe...
🚨 CHART ANALYSIS + WARNING 🚨 Crypto Total Market Cap (4W Chart) From what I’m seeing — and I don’t say this lightly — we are possibly witnessing the setup for the greatest bull run in crypto history. Let me break this down with some actual chart work: 📊 Market Analysis: • We're currently bouncing off the 0.382 Fib level (~2.86T) and pushing toward the 0.618 zone...
XRP/USD is giving us that candle retracement setup that I’ve been waiting on. Based on structure, it’s looking like a clean retest of $2.65 is right around the corner. 🔁📊 I’m not basing this off hype. This is pure chart behavior. The candles are showing strength, and the path is looking like it’ll sweep through this key level before pushing higher toward the...
Lately, I’ve been seeing a lot of chatter about buying NYSE:UNH — UnitedHealth Group — as if it’s the “big opportunity” after the drop… But let’s keep it real — the chart isn’t confirming that yet. 👀 Take a close look 👇 Price completely broke structure from previous highs around $630. The recent drop was aggressive, and there's no clean retest or setup...
We’ve seen a temporary rejection at the $2.65 zone, but make no mistake — the macro structure is still intact. 📉 Current price action on the 14D shows a pullback, but zooming out across the 2D and 12H confirms consolidation within the bullish continuation pattern. 🔹 $2.21 is holding 🔹 Trendline from the 20H low remains respected 🔹 No break of structure — just...
📊 MicroStrategy ( NASDAQ:MSTR ) – Fibonacci Extension Zones Not saying it'll reach these levels… but just look at the psychology when you stretch those Fib lines. 🔭 This setup shows: 🔹 Previous High: $543 🔹 1.618 Extension: $735 🔹 2.618 Extension: $1,046 🔹 3.618+: 💥😳 IF it were to split? Game on. Past price doesn’t guarantee future movement — but the Fib...
I marked this move way before CNBC dropped the article. Now they’re saying Coinbase will be added to the S&P 500—but the chart already told the story. Structure was forming, levels were building, and all it needed was a catalyst to push through. That’s why understanding market structure is everything. News will always come last. The smart money already knew....


