OpenYourMind1318
EssentialThis might seem obvious to some, but it’s worth emphasizing — 📌 When analyzing charts like this, switch to a Line Chart instead of Candlesticks. Why? It filters out market noise and shake-outs You can clearly see how price respects key zones and levels Candles often distort the picture with wicks — line charts show the real body movement Bullish Setup: Market...
In my view, we are still in the accumulation phase. The current price action and reactions at key levels suggest ongoing accumulation. 🔻 Bearish Scenarios: In the short term, a retest of the lower boundary of the accumulation zone (purple box) is possible if the market weakens. The worst-case scenario would be a move down to the lower green support zone, which...
Ethereum Classic is trading at a key long-term support zone, bouncing from the lower bound of a multi-year ascending channel. Historically, this zone has triggered large rallies (2019, 2020, 2021). Major resistance levels are stacked at $24, $42, $77, and $103. If the price holds above $22–24 and breaks out with volume, it could retest the mid/high zones of the...
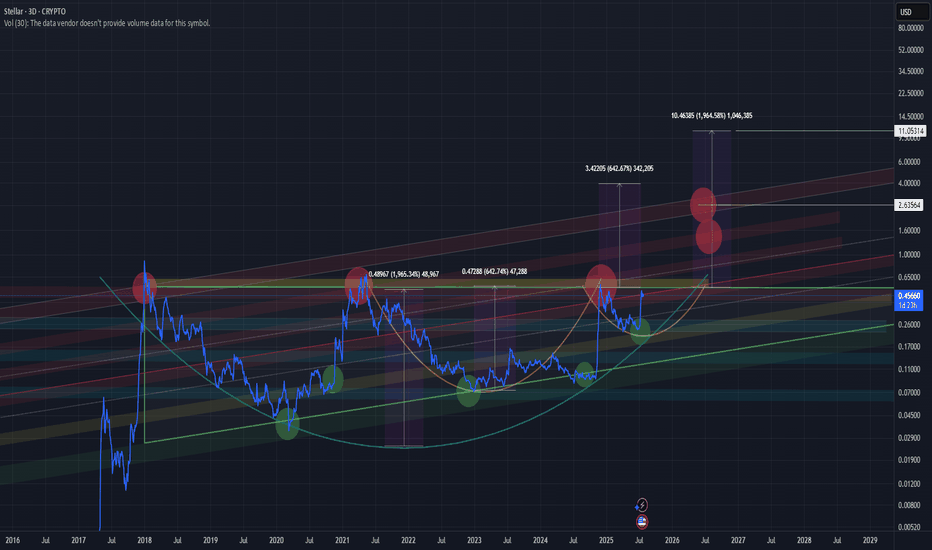
XLM is showing one of the strongest bullish setups right now. A macro “Cup”, with a smaller “Cup with Handle” forming inside it — a powerful setup often leading to parabolic breakouts. Before a true breakout, price may fake out to the downside, trapping longs. This is classic market maker behavior — shakeouts followed by strong reversal and breakout. Stay...
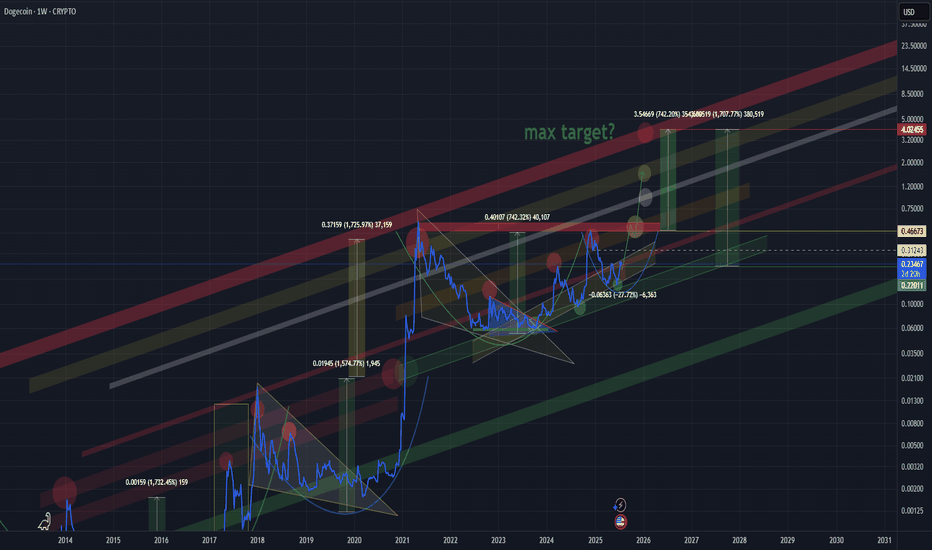
☕ Cup and Handle Forming Again – Targeting $4! Just like before — we are seeing a massive “Cup and Handle” pattern forming. Last time, the exact same structure played out, and the price perfectly reached the previous high upon completion of the pattern. 📌 Current Setup The cup is already formed, and now we are clearly drawing the handle If history repeats —...
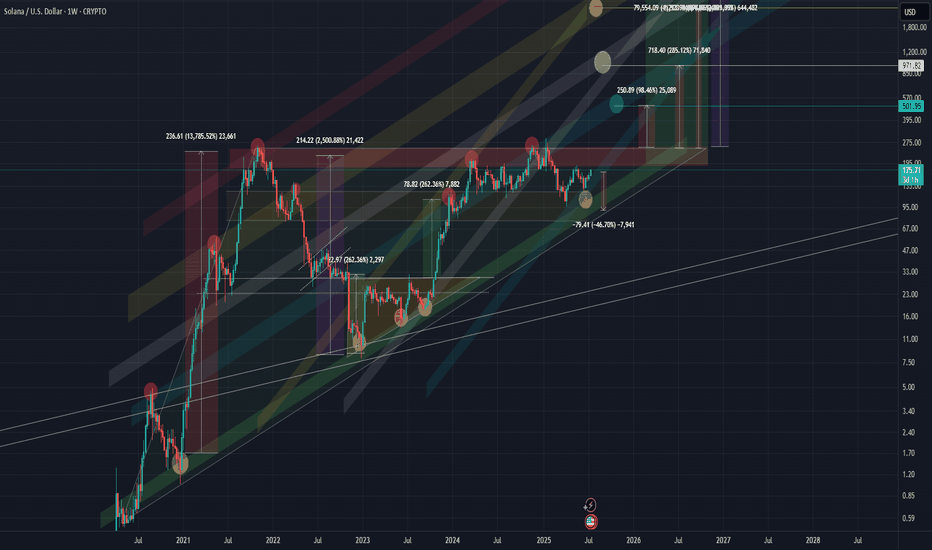
This coin is showing very interesting development, and the market maker seems to be painting clear structural patterns. 🔷 Macro Structure: Rising Triangle On the higher timeframes, we can clearly see a rising triangle formation taking shape. If this pattern breaks out to the upside, the potential measured move suggests a target of up to ~2,500% from current...
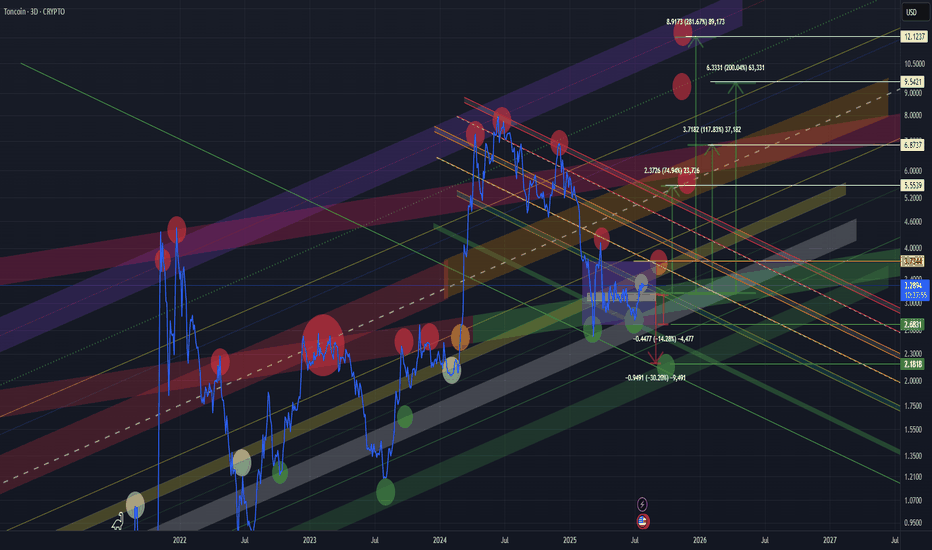
Decided to update the idea. As always, key support and resistance levels are marked on the chart — along with price reactions at those zones. Currently, we’re observing a potential breakout from a bull flag formation. The mid-term target lies in the $2.3 – $3.4 range, with a possible extension up to $4.8 as a maximum target. ⚠️ Don’t forget: there’s still a...
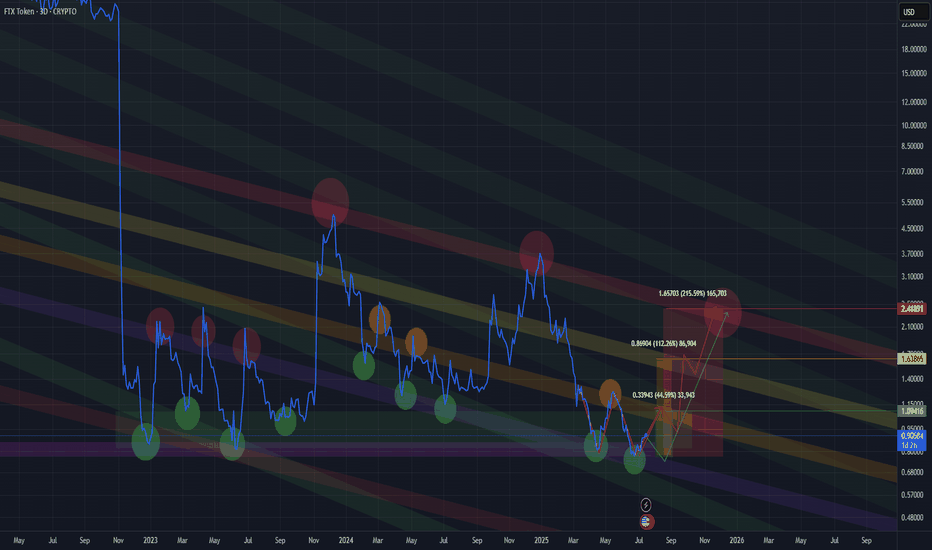
High-risk play with strong potential. Targets are on the chart — previous setups speak for themselves. Keep in mind: we might see a retest of the ‘W’ formation before breaking higher. Don’t rush in — patience could pay off. Simple setup — now it's all about execution. 🚀
🔹 Accumulation Phase in Play We’re currently sitting in a clear accumulation zone — price is holding steady, showing signs of position-building by stronger hands. 📈 The next key areas are distribution zones, all of which are already marked on the chart. If you're entering a position now, odds are high you'll be able to secure profits as we move up. Just make sure...
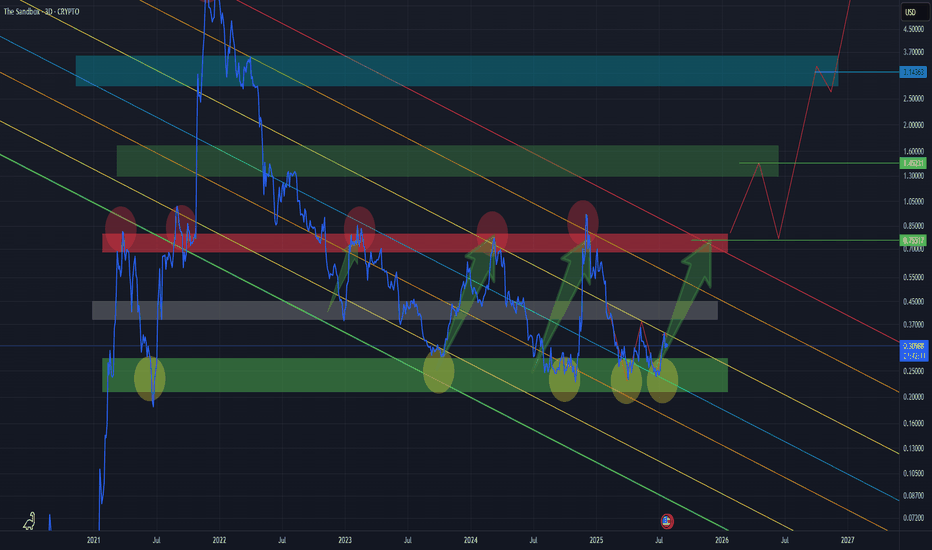
I’m not sure if there’s a specific method of analysis for this, but it’s clear how precisely the coin reacts to these levels. That’s why I dare to assume we won’t go any lower. The green line has consistently acted as a strong support — almost like a trampoline that price bounces off. All realistic and objective targets are already marked on the...
(CRYPTOCAP:TOTAL3-CRYPTOCAP:STABLE.C)/CRYPTOCAP:BTC This formula strips out the noise and gives a true altcoin-to-BTC strength indicator. STABLE.C removes all major stable coins (USDT, USDC, DAI, etc.). The chart clearly shows previous capitulation zones and launch points for altseasons since 2017 Current formation – potential triangle: Market makers appear...
The market has priced in most scenarios. At this point, the chart tells the story — and it’s playing out as expected
$5.48 is an almost guaranteed target — it has been reached every single time. What happens next depends entirely on the strength of the trend. If we break out above the triangle and hold above it, there’s a real shot at $20. And if that level gets broken and confirmed — then we might even see a retest of previous ATH. But those are already "moon targets", and by...
Tilt your head a little to the left — and you’ll see it all. We’re currently in the accumulation zone, the phase of position building. Future price targets are already mapped out on the chart. All ideas are shared strictly for spot trading — no futures involved!
Each cycle typically spans 4 years. Historically, the cycle peak occurs near the end of year 3, followed by a year-long market downturn in year 4, with the cycle bottom forming closer to the end of that final year. Based on previous cycles, a reasonable peak for Bitcoin in this cycle would be around $120K–130K, followed by a correction down to the $45K–50K range.
Channels are drawn, long-term targets are clear. The upper extreme visible so far is around $200K for Bitcoin — possible within this cycle. More realistic targets for this cycle are around $135K. In the short term, a correction to the lower red channel zone ($88K–94K) is possible. Watching closely.
As before, previous highs often turn into support levels — price respects history. The targets I’m sharing are long-term and global. At the moment, I’m watching a triangle formation. It could break out to the upside, or we might see a pullback to retest support, likely near one of the prior highs.
TOTAL2, TOTAL MARKET CUP without BTC Reasonable targets are within the yellow zone — these are high-probability levels based on current price action, volume, and market structure. They offer the best risk/reward and are ideal for primary take-profit planning. Targets outside the yellow zone are still possible but come with higher risk. They typically require...
