Orriginal
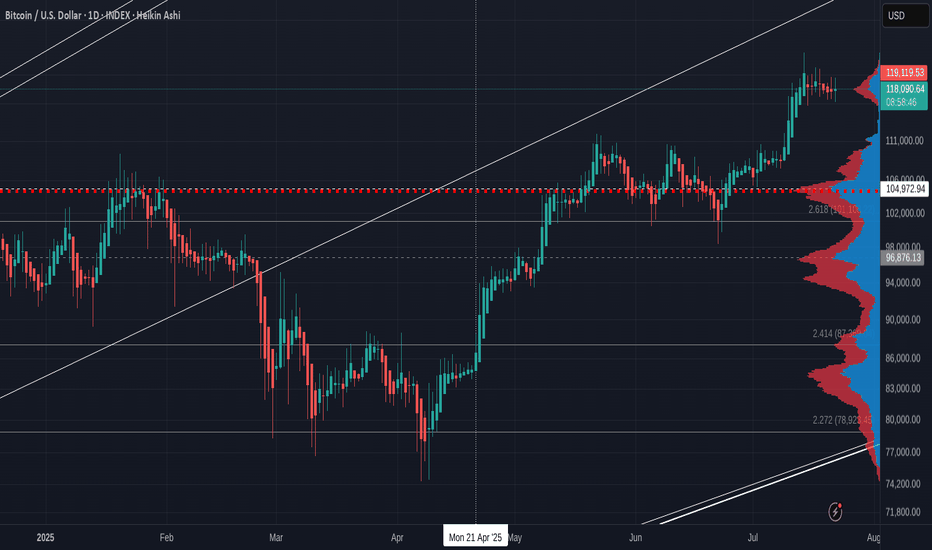
PremiumThe descending diagonal "line" is another of those 618 Fib circles. You can see very clearly on this chart what happened the last 2 occasions PA hit one of these. I have little reason to expect things to be any different this time. As a result, we could revisit 107K HOWEVER, we do have the 50 day SMA just below, around 112K, and this could act as support in...
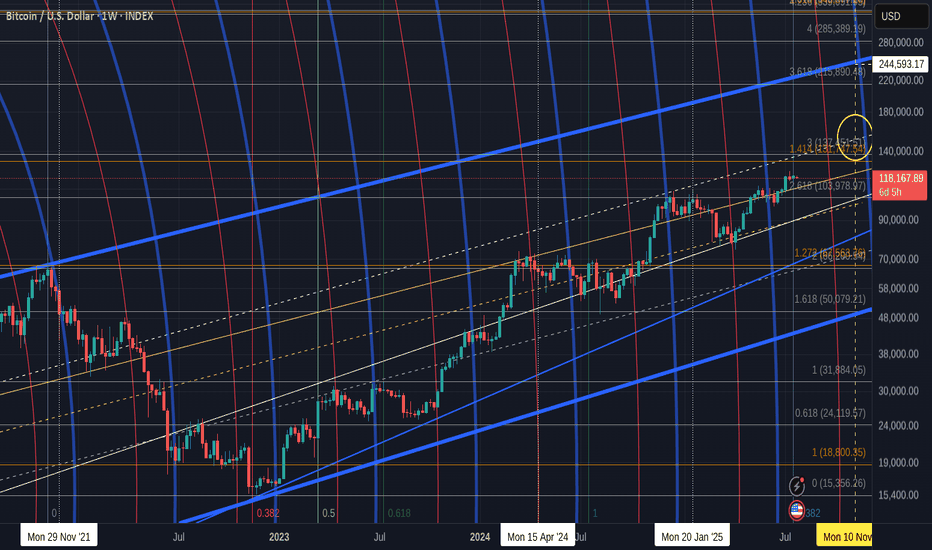
It is VERY clear to see and some just do not want to see it That Blue Arc, Arrowed, is an Arc that has rejected EVERY ATH since Bitcoin began rising from its early Low. And also understand, that arc is not just a random line, It is Calculated and is part of a Fibonacci Spiral. ANYWAY, as we can see on the chart. PA is heading to a Squeeze with this Arc and a...
As mentioned previously, these are traditionaly used to find Entries into a market and so far, this has been the case again. We have dipped to 112K so far and as yu can see, we can go to 103K with ease, should this be allowed by the Bulls. I will say, the SOPR (Spent Output Profit Loss ) chart has offered a Bull wanting caution flag.. And yet, on the lower time...
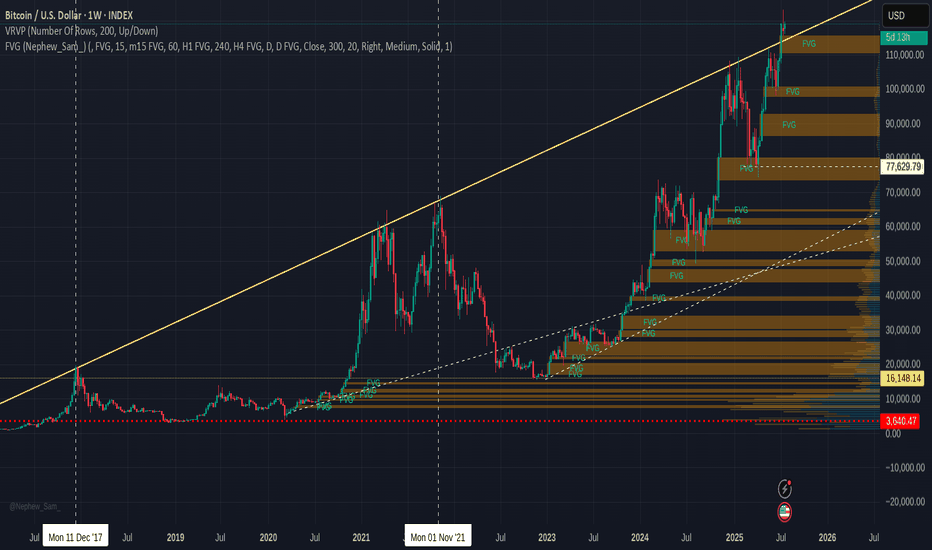
If you look back at the last time I posted a chart with Free Value Gaps ( FVG ) you will see an orange bar where PA currently sits...The reason it is no longer there is because it ogt "Filled" It is much the sameidea as CME Gaps. Thay also get filled very often/ So, we can see 2 more FVG before 107K line and so, in the current market state and with the...
We got the expected GREEN July and so, amazingly, we continue to repeat the pattern from January to July 2012. ( Left Box ) It is almost the same pattern as 2020, apart from the Red May candle in that Year. (Right box) The Large Arrow points towards another occasion where we had a series of consecutive Green candles from March to July, though these candles sizes...
After we heard the US Federal Reserve hold rates yesterday, Markets Fell some. And Bitcoin joined them for a couple of hours but Look now. While the $ falls, the S&P Falls, GOLD is the traditional haven of safety and we can see how it Rose in Value over the last 12 hours The $ has Fallen over the last 8 hours S&P Stalled for the last 24 hours And the...
When you look on 1 hour or 4 hour charts, our hearts miss a beat... "Bitcoin is Crashing" But as you can see on a weekly chart, it really is nothing more than a little hiccup...not even that ! We can drop to 110K before you need t really watch This cycle has seen so many similar instances. But we do need to be alert to make sure this fall does on continue...
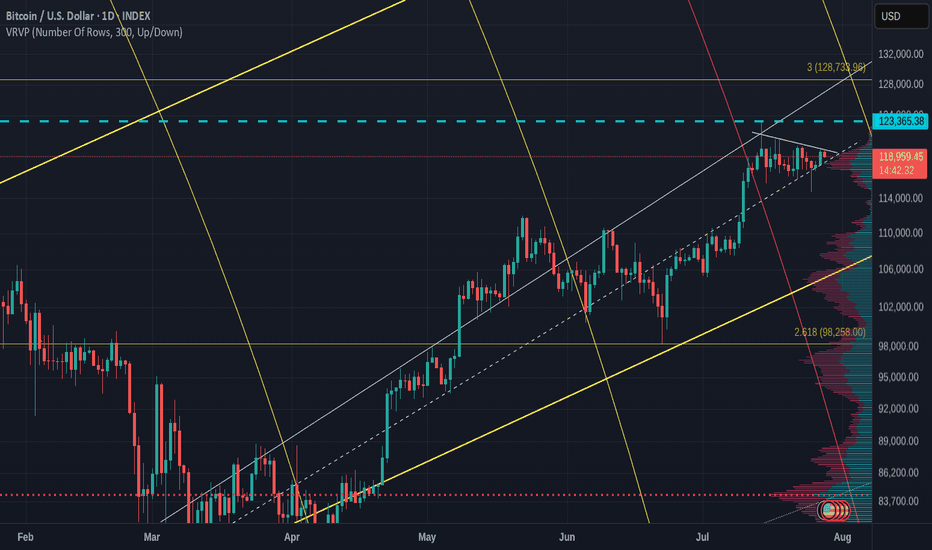
No Guesses which one. Bitcoin printing a Bullish pennant on the daily with the Apex late this Wednesday, After the FED tell us what they are doing with interest rates PA always reacts before the Apex. ETh on the other hand, is under a Huge area of long therm resistance and running out of steam If we zoom out to the weekly, we can see how long this line has...
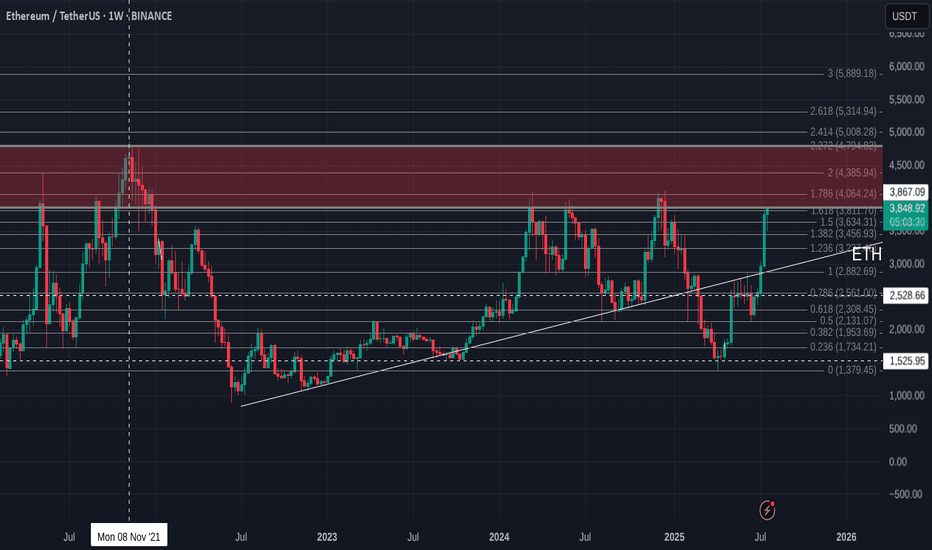
There is a saying- "Charts NEVER lie" And here it is ETH USDT Weekly chart, suggesting that, right now, ETH is up against resistance that has rejected it more times than it has been support. The RSI on this chart also suggests a pull back is coming Again, RSI has been rejected in this range more times than it found support Conclusion -WAIT before you buy...
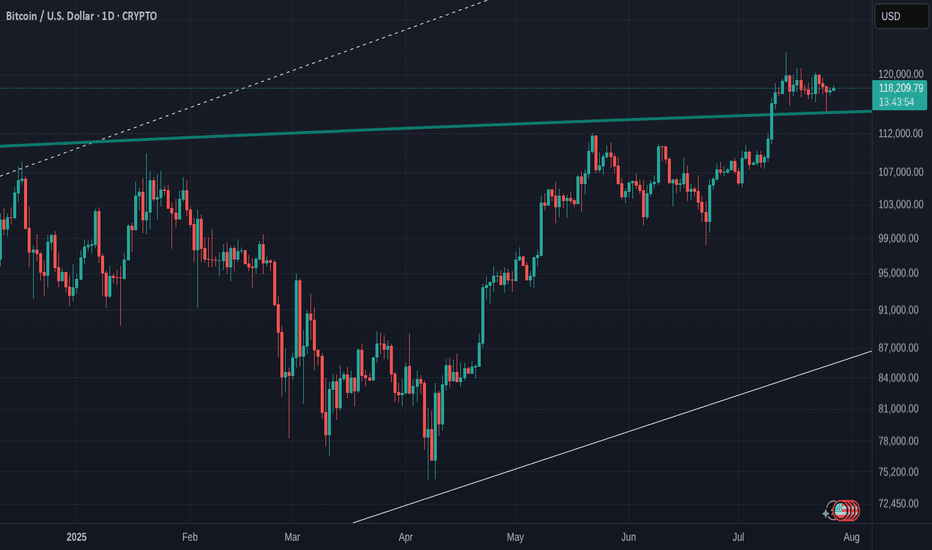
The question I will answer in this post is "What is the significance of that Blue line that BTC PA is now sitting on" On the Daily chart, we can see it has been tested as support and Held. Previously, it was resistance.. So what ? This has happened many times before. Lets zoom out and look at the weekly. So, we see that the Blue line was also the rejection...
As mentioned yesterday, ETH has hit long term resistance and got rejected....and it is happening again ETH seems unable to find the moemntum just yet. The MACD Daily is still turning Bearish The Daily RSI is also up high and likely to fall The weekly RSI is also high though the Weekly MACD has still yet to rise above Neutral All in All, for me, it is...
The sharp drop caused by Galaxy Digital seel off has brought PA to a line of support but also to the top of a Fair Value Gap ( FVG) This could cause a further slide as traders decide to try and pick up some BTC from this gap. FVG have a tendancy to be used as Good trading spots due to the lack of previous trading in that range So, if support breaks, we could see...
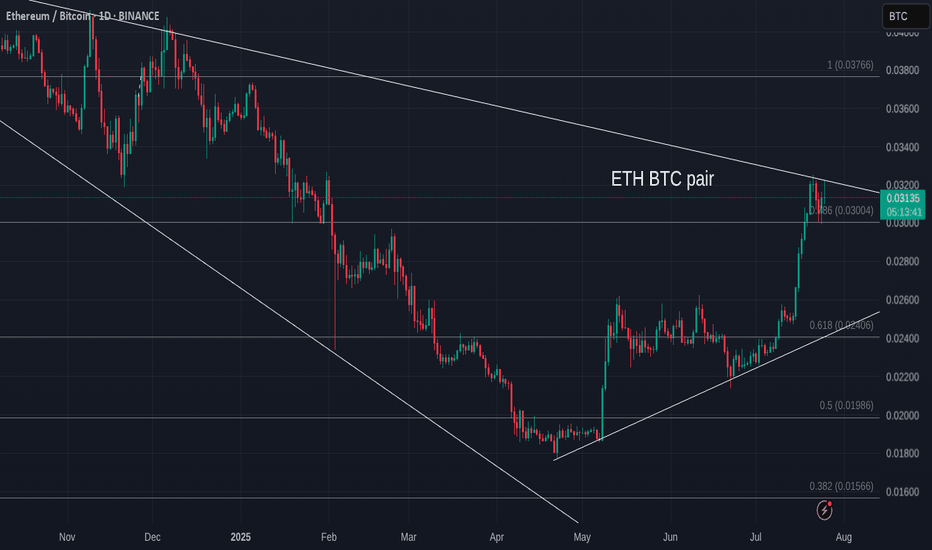
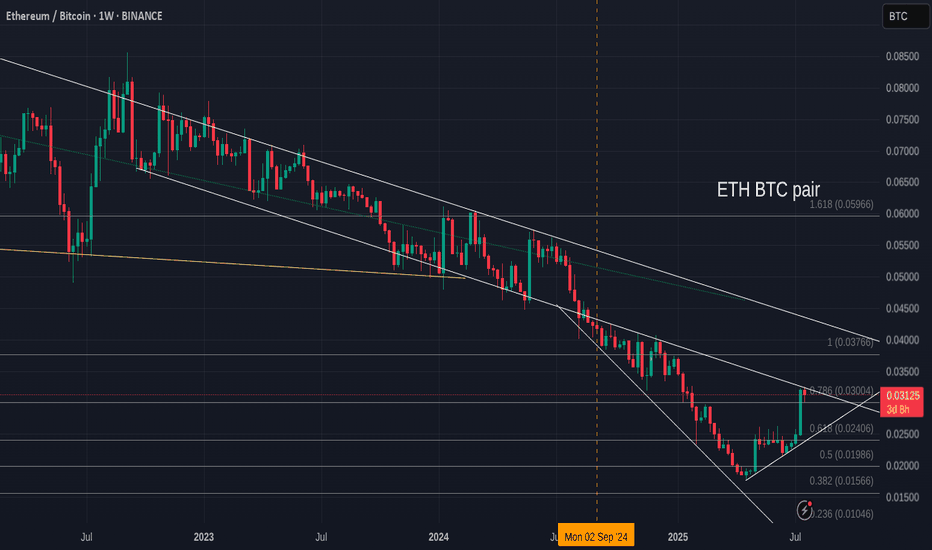
Ever since Nov 2021, ETH has Lost Value compared to Bitcoin, as we can see on this ETH BTC chart. Even while Bitcoin entered a Deep Bear market, ETH lost More.... And now, as we see ETH make a strong move, we have people screaming, "ETH to 10K" And given how ETH is backed by almost everything American, as America wants ETH as its own Crypto. Nut lets look...
There are aq number of things to see here. The main chart shows us PA raning in a tight range, with possible support on the VPVR on the right The dailu MACD Shown below Is turning bearish BUT could we see the same as the arrow ? Maybe but the ADX shown below does lead to some caution being required The Daily ADX is up high and could Very easily turn ...
An explanation of what a FAIR VALUE GAP ( FVG) is at the end of this post. The stand out for me here is simply how almost EVERY Fair Value Gap ( FVG) gets filled in every cycle. There are very few FVG from the 2017 to 2021 ctcle and only one from 2013 to 2017. The question I now pose to myself is what will happen this time ? Because things are very...
All the Cries of "ALT SEASON AT LAST" could be about to stumble if BTC.D finds support on the line of support shown in the chart , that has provided support previously. There is no way of knowing if it will bounce or not but CAUTION IS A VERY GOOD IDEA We will know soon enough
Bitcoin 4 hour PA getting into a squeeze and a move should be expected by Thursday this week. There are some conflicting messages coming out. Top indicator hwre is Bullish Bearish sentiment and we can see the Bullish is running Low and we could head into a Bearish zone in the shorter term and possibly for longer towards the end of the month. Next indicator is...


