To spot the beginning of an Altseason, there are several key charts you need to track on TradingView. These indicators show whether capital is really leaving Bitcoin and flowing into altcoins. 1. Altseason Starts with ETH Almost every time, the first signs come from Ethereum (ETH). When ETH gains strength, the rest of the altcoins usually follow. 2. BTC...
On the weekly chart, Bitcoin dominance has rejected from the 70% Weekly OB supply zone and is now pulling back. We currently have three major Weekly OB demand zones below: 54–55% OB 48–50% OB 40–42% OB Possible scenarios: 1️⃣ A temporary bounce before continuation lower. 2️⃣ A steady decline into one of the OB zones (50% or 42%). 3️⃣ A strong breakdown below...
On the daily chart, Ethereum is consolidating below the ATH resistance (4859) after a strong rally. We currently have two major Daily OB demand zones: First Daily OB around 3200–3600 Second Daily OB around 2400–2800 From here, I see three possible scenarios: 1️⃣ Continuation without deep retracement → Price holds above 4100 and breaks ATH (4859). 2️⃣ Shallow...
On the 1H gold chart, price recently reacted to the FVG (red zone) at 3410, showing a clean rejection and shifting order flow to the downside. Below the current price, we have three key bullish OB zones: First green OB around 3460, acting as the closest demand zone. Second green OB around 3310, a deeper liquidity zone. Third green OB at 3287, a stronger...
ETH has recently rejected from the 4,370 area, showing signs of short-term exhaustion. On the 1H chart, a clear FVG is located around 4,100, which could act as a liquidity target if selling pressure continues. Below that, we have a strong Bullish OB around 3,900, aligning with previous demand and potential reversal interest. If price retraces into the FVG zone...
On the 1H timeframe, price has entered the green demand zone (1H FVG) around 1.1480 – 1.1520 after a strong bearish leg. We're expecting a bullish retracement from this zone, aiming toward the upper red FVG/OB zone around 1.1690 – 1.1715. 📌 There are two key scenarios: 1️⃣ Scenario 1: Price starts moving up from the green FVG → reaches red FVG zone → short...
On the 1H chart, price has made a sharp bullish move from the lower 1H OB zone (3,275 – 3,285) and is now hovering just below the 1H supply zone. 🔴 1H Supply Zone (OB): 3,354 – 3,368 → Price is consolidating here with no strong rejection yet. 🟢 1H Demand Zone (OB): 3,337 – 3,344 → First area to watch for potential bullish reaction. 👁 Mid-level support zone...
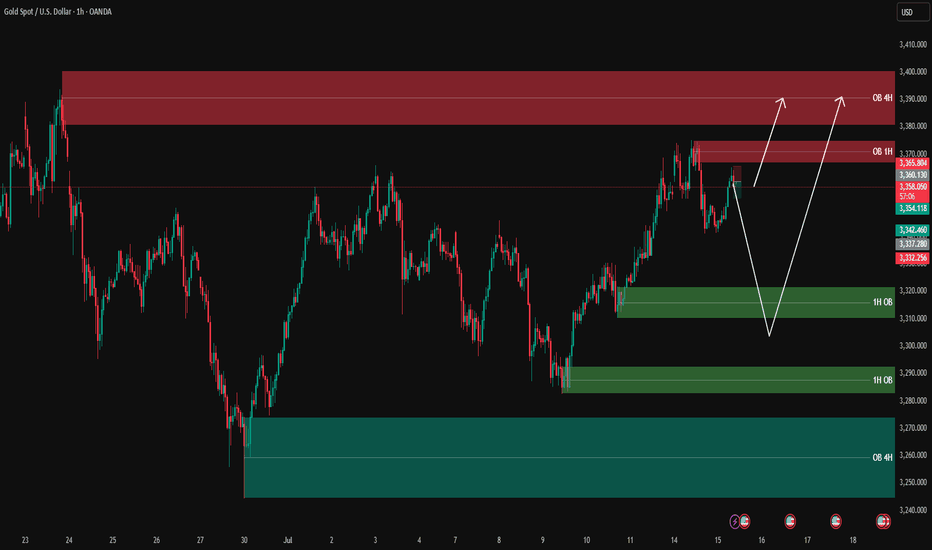
On the 1H timeframe, price is currently approaching two key supply zones (OB 1H): 🔴 First OB zone: around 3354 – 3360 🔴 Second OB zone: around 3368 – 3370 We're watching these zones for potential short setups, only with confirmation on the lower timeframes (5M or 3M). If price reacts to one of these OBs, we expect a move down toward the green 1H demand zone...
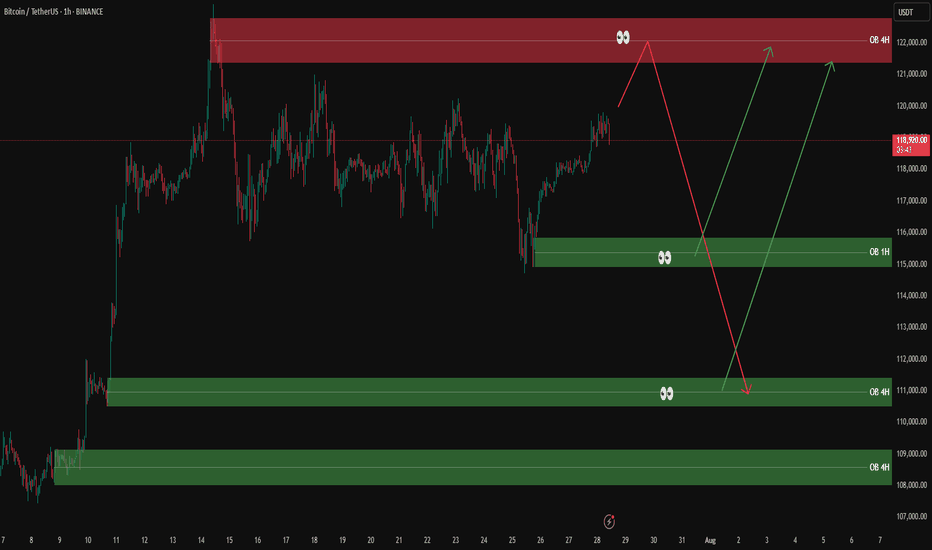
✅ The overall market trend is still bullish on the 1H and 4H timeframes. However, we’re watching the red 4H supply zone (around 122,000) closely for a possible short-term sell setup. 🟥 If price reaches this red OB, we’ll look for a light short position only with confirmation on the 5M or 3M timeframe. 🟩 On the downside, we are mainly interested in buy setups...
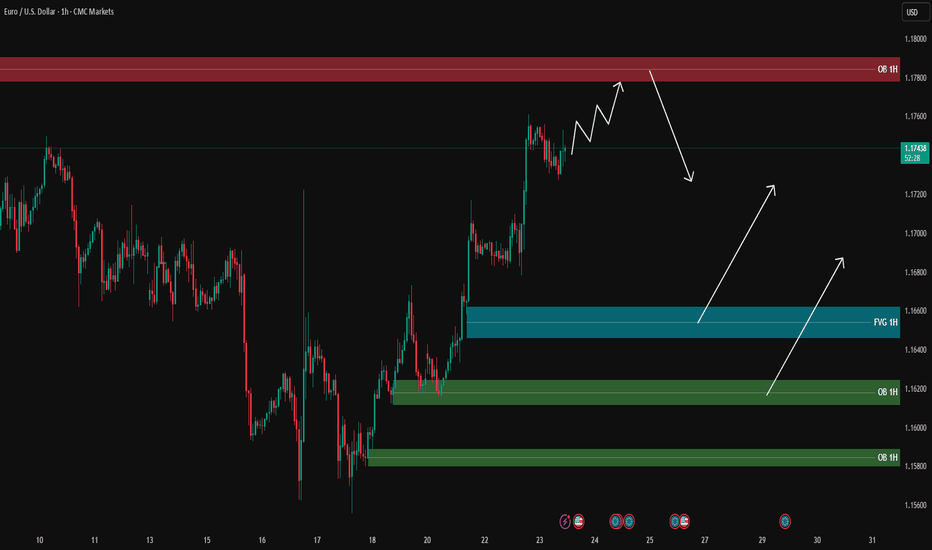
On the 1H timeframe, price is moving strongly towards the 1H supply zone (around 1.1780), and it is likely to reach this area first before pulling back. During the pullback, the blue FVG and green OB zones below are key areas for potential long entries: 🔹 FVG 1H around 1.1660 🔹 OB 1H around 1.1620 🔹 OB 1H around 1.1580 📌 Plan: 1️⃣ If the price reaches the...
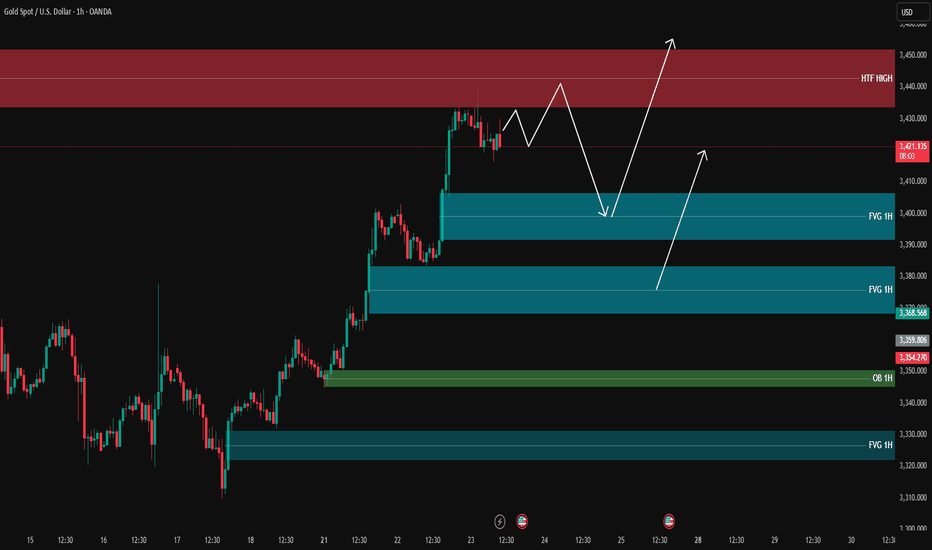
On the 1H timeframe, price is reacting as it approaches the HTF high zone (3430-3450) and is currently pulling back. The 1H FVG zones at: 🔹 3400 🔹 3368 and the 1H OB around 3350 are key areas we are watching for potential long entries. 📌 Plan: We will wait for price to pull back into one of these 1H FVG/OB zones and look for entry confirmations on the 5M or 3M...
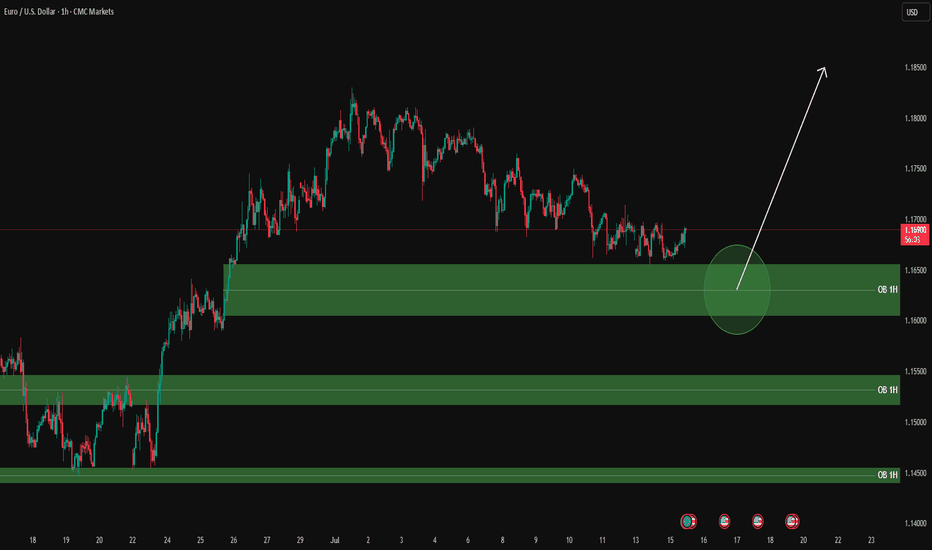
✅ Green zones = 1H Buy Order Blocks Clean plan: Wait for price to reach the green circle zone (1.1600 – 1.1650 OB). Once there: ✅ Drop to LTF (5M / 3M) and wait for: Price reaction to the OB zone BOS / CHoCH structure confirmation Strong bullish candle for clean entry Then, enter with stop below the OB zone. 🎯 Targets: First TP: 1.1690 – 1.1700 Second...
✅ Green boxes = Buy Order Blocks (OB) ✅ Red boxes = Sell Order Blocks (OB) ✅ Blue boxes = Fair Value Gaps (FVG) (none currently on this chart) Currently, gold is approaching the 1H Sell OB (red) between 3360 – 3370, which is a strong resistance zone. We have two clear scenarios: 1️⃣ If sellers step in and we get confirmation, we can look for a pullback down to...
🔹 Price is currently trading around 1.1421, consolidating between key supply and demand zones. 🔴 Supply Zone (Order Block 1H): 1.14360 – 1.14590 📌 Strong bearish reaction from this resistance area. First scenario: rejection from this OB and a move downward. 🔵 Demand Zone (Order Block 4H): 1.13050 – 1.13430 ✅ If price fails to break the resistance, we could see...
📍 Gold is currently trading around 3375 USD and gaining bullish momentum with the London session opening. 🔸 Key Zones: 🟨 Critical Resistance (Orange Zone): 📍 3378 – 3384✅ Price consolidation zone – if broken with strong volume, a bullish continuation is likely. 🔴 Supply Zones (FVG): 1️⃣ Upper FVG 1H:📍 3386 – 3397 2️⃣ Main Supply Zone FVG 1H:📍 3405 – 3422 🟢...
🟠 Price is consolidating around 104,500, sitting right on the short-term ascending trendline. No clear breakout yet. 🔴 Supply Zones: 1️⃣ OB 1H:📍 107,800 – 108,600📌 Strong rejection zone that led to the current decline. 2️⃣ OB 4H:📍 106,100 – 107,500📌 Key resistance zone – a valid break above may trigger bullish continuation. 3️⃣ Upper OB 1H:📍 110,700 – 111,400📌...
As mentioned in our previous post, we were waiting for price to react from one of the key demand zones: 🔹 1.12250 – 1.12500 🔹 1.1190 – 1.12060 ✅ We entered a long position on the 3-minute timeframe after getting a personal confirmation trigger. The result? An exceptional entry with a minimum of 100 pips profit so far. 📍 Now it's time to secure profits and wait...
Gold is currently reacting to key resistance zones, and we are watching for signs of either rejection or breakout. 🔴 1H FVG Resistance Zones: 3408 – 3425 3386 – 3400 If price fails to break through these levels with momentum, we may see a downward move toward lower demand areas. 🔵 1H FVG Support Zones: 3323 – 3336 3276 – 3290 3242 – 3256 3152 – 3166 🟢 4H...


