Technical Analysis (Daily Chart) Trend Structure: The stock is riding a steady uptrend, with price comfortably above the 5-, 9-, and 21-period EMAs—signaling robust momentum. Consolidation Base: A plateau formed around ₹780–820, anchoring a clear base from which a potential breakout may emerge. Key Levels: Entry: Buy near breakout above ₹820–825 with...
Technical Analysis (Daily Chart) Indicator Setup: The price is trading above the 5, 9 & 13 EMAs—all aligned bullishly—indicating a positive trend. Key Levels: Resistance Turned Support: Around ₹203–205 Next Resistance / Target Zone: Near ₹217–220 (recent swing high) Momentum: The breakout above the consolidation zone is showing strength. Trade Plan: Entry:...
🧪 Technical Analysis (Daily & Weekly Setup) Trend & Moving Averages: Price is trading above the 5‑, 9‑, and 13‑period EMAs, indicating a clear bullish momentum. EMAs are aligned upward, suggesting trend continuation. Support & Resistance Zones: Immediate support lies around ₹1,100‑₹1,150 (recent consolidation). Strong resistance lies at ₹1,180‑₹1,190 (near...
📈 Technical Analysis (Daily Chart) Current Price: ~₹248 Resistance Zone: ₹238–248 (recent breakout with strong volume) Support: ₹220 (recent consolidation zone) EMA 5‑9‑20: Bullish alignment with price above all three Trend: Price has broken out of sideways base on rising volume, showing renewed strength and momentum 🎯 Trade Plan: Entry: ₹250–252 (above...
CMP: ₹667.35 Breakout Level: ₹657–660 (now turned support) Support Zones: ₹657, ₹618 Resistance Levels (next targets): ₹705–710, ₹735 Indicators: Supertrend: ✅ Bullish TEMA 5-9-20: ✅ Trending up Volume/Price Action: Strong bullish candle post consolidation 📈 Technical View (Positional) Laurus Labs has broken out above ₹657 resistance with strong momentum,...
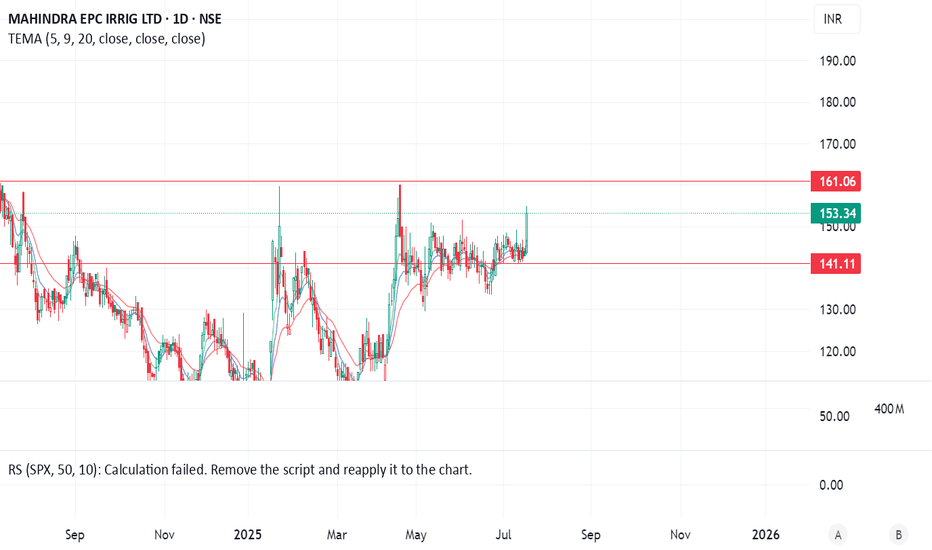
Technical Analysis (Daily Chart) CMP: ~₹153 Key Levels: Resistance around ₹155–161 (tested multiple times). Support at ₹141. EMA 5‑9‑20 stack is bullish and rising (~144–146 zone). Price Action: Clean breakout above ₹153–155 signals strength. Volume: Volume surged on the latest breakout—strong buying. Momentum: Short-term RSI turning positive (invisible but...
Technical Analysis (Daily Chart) CMP: ~₹880 Resistance Zone: Approaching strong overhead resistance at ₹890–900 (prior highs). EMA 5–9–20: Stack is bullish and sloping upward (current EMAs ~₹830). Chart Pattern: Potential bullish breakout setup; look for a clean close above ₹900. Momentum & RS: Relative strength versus SPX is turning upward—hinting at upside...
Technical Setup (Daily Chart Analysis) CMP: ₹223.89 Zone: Price testing a major horizontal resistance at ₹224–228 zone — acting as a neckline from past multiple swing highs. Structure: Cup & Handle formation on higher timeframe (bullish continuation pattern). EMAs (5/9/20): Trending above all short-term EMAs (215–216 zone), showing strength. RS Line:...
Technical Setup (Daily Chart) CMP: ₹362 Structure: Approaching a multi-month resistance at ₹370 (marked on chart). Price is squeezing near breakout point. EMA Setup (5–9–20): Bullishly aligned; price holding above all EMAs with strength. Volume: Gradual build-up, indicating accumulation. Momentum: Positive divergence forming with RS SPX. Pattern: Classic cup...
Technical Setup (Daily Chart) CMP: ₹309.20 Breakout: The stock has decisively cleared resistance around ₹288 with strong momentum. EMAs (5–9–20): Recently aligned upward, indicating bullish momentum. Entry: Consider entering on a confirmed close above ₹288–290. Stop-Loss: Place a daily close stop below ₹288. Targets: 🎯 T1: ₹340 🎯 T2: ₹380 🧾 Fundamental...
Technical Analysis (Daily Chart) CMP: ₹287 approx Pattern: Approaching major resistance zone at ₹290–295 (prior highs). Watch for a breakout or rejection. EMA 5‑9‑20 Setup: EMAs are stacked bullish and trending upward, showing improved momentum. Trade Entry: Wait for a decisive close above ₹295 (breakout confirmation). Stop-Loss: Place below the breakout...
Technical Analysis (Daily Chart) CMP: ₹256.60 Structure: Recently broke above resistance around ₹245–255 on steady volume, with tight 5‑9‑20 EMA alignment signaling momentum shift to bullish. Support Level: ₹245–250 (former resistance, now support). Stop‑Loss: Daily close below ₹245. Targets: 🥅 Target 1: ₹285 (next resistance) 🥅 Target 2: ₹320+ 🏦...
Technical Analysis (Weekly Chart) 📊 Setup Details: CMP: ₹2,796.60 Price has broken out above the ₹2,348 resistance and retested it successfully this week with a strong breakout (+7.4%) 🔥. EMA Stack (5‑9‑20) trending up, reinforcing bullish momentum. Volume increased significantly on the breakout — a positive signal. 💹 Key Levels & Trade...
📌 Timeframe: Weekly 📈 CMP: ₹1,969.50 🧭 Structure: Stock has retested breakout level of ~₹1,800–1,820 zone and shown strong bullish reversal this week (+7.39%). Sustaining above ₹1,820 confirms breakout retest success. Volume confirmation along with rising 5/9/20 EMA stack = strong positional continuation signal. RSI healthy and rising – not yet overbought. 🔍...
📌 CMP: ₹5,177.90 📈 Technical Structure: Stock has cleared a multi-month resistance around ₹5,090–5,100 Strong bullish momentum, with increasing volume Clean rounded base breakout, suggesting trend reversal 📊 Indicators: Trading above TEMA 5/9/20 – bullish signal Supertrend also likely supporting a buy signal (though visually hidden) RSI in bullish territory...
Chart Pattern: Cup and Handle Formation CMP: ₹101.33 Technical Structure: Classic bullish Cup & Handle breakout setup in progress Volume: Noticeable rise in volumes at breakout zones Momentum: RSI & moving averages support the trend continuation 📊 Technical Levels (Positional Setup) Support Zones: ₹95 / ₹90 Breakout Zone: ₹101–104 (once cleared, confirms the...
📍 Chart Analysis Summary CMP: ₹1513.20 Structure: Strong breakout from a rounded base; retesting previous resistance zones Volume: Gradual accumulation with spikes on breakout sessions Momentum: RSI supportive of upside continuation 📊 Technical Levels (Positional Setup) Support Zones: ₹1435 / ₹1370 Resistance Zones: ₹1575 → then ₹1710 Breakout...
CMP: ₹300.80 Immediate Resistance: ₹306 Support Levels: ₹277 / ₹267 / ₹254 Structure: Rounded bottom breakout in progress after a prolonged downtrend recovery Momentum Indicator: RSI near breakout confirmation, strength building 📈 Technical View (Positional) Price is retesting key resistance at ₹306 — a breakout above this level may unlock a fresh upside...


