SILICIDE
EssentialPrice has reached the 0.5–0.382 Fibonacci retracement zone of the recent swing. If the bears are strong, we may see a rejection toward the trendline support. However, if this resistance is broken, a bullish continuation is also possible. Let's see how it plays out.
Solana has recently retraced from the 0.318 Fibonacci level of its latest swing and is now positioned to potentially test the resistance zone between $180 and $185.
EUR/USD is currently in a downtrend and trading within a developing channel pattern. The structure isn’t fully formed yet, but a minor upward move is likely in the short term, toward a key resistance area where two resistance levels intersect. This confluence increases the probability of a downward reversal from that zone. However, in the event of NFP news...
Litecoin (LTC) recently broke out of a bullish wedge pattern, faced rejection around the $128–130 resistance zone, and has since retraced to the 0.5 Fibonacci level — presenting a potential entry point, with a stop-loss placed below the 0.382 Fib and a target around $140.
Gold after breaking the support, now again reached the support level which will be its resistance now, will it break it or get rejected form here. Enter the long only on breakout and retest till then its bearish trend.
DOGE/USD has broken out of the bullish wedge pattern. The 4-hour candle has not yet closed, so it's best to wait for confirmation. Consider entering the trade on a retest of the breakout level. Target: Around $0.25 Stop Loss: Around $0.20 Let’s see how it plays out.
PENDLEUSDT is currently trading within an upward channel. Yesterday, the price pulled back to the channel support and formed a bullish engulfing candle, indicating potential continuation of the uptrend. A move toward the channel resistance appears likely. A long trade can be considered with a stop-loss at 3.5.
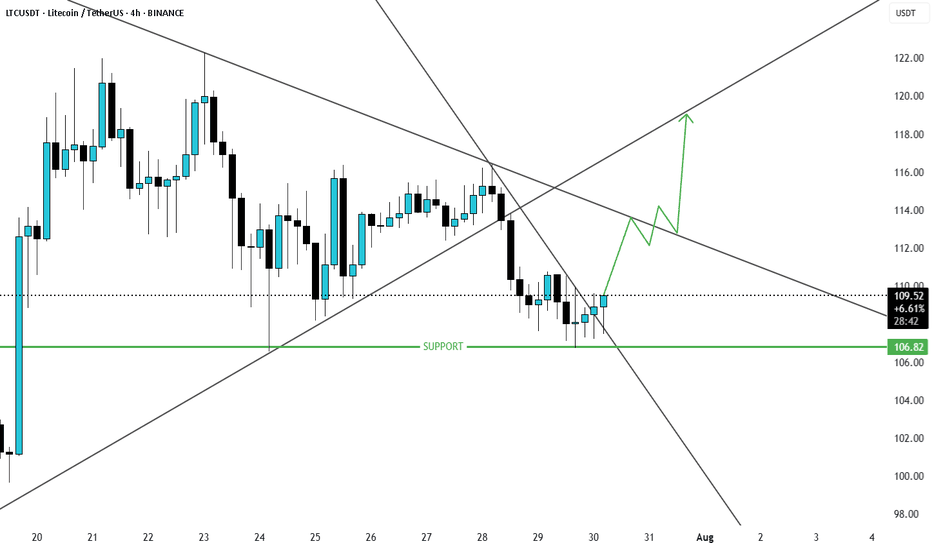
LTCUSD trading in a down trend has now broken the resistance and wait till the candle is closed and possibly retest and then enter the trade. target can be 118-120
as long as the price is above this suport BTCUSD is bullish and if price drops below these support then short term bearish may be possible. let us see. currently price is rejecting from fib 0.5 of recent swing
INJUSD has forme a Ascending triangle pattern and looks like double cup and single handle pattern.
SOLUSD yesterday broke the O.5 Fib level and price may further go down to trendline support from where price may get reverse.
BTCUSD is trading in range bound way and soon may breakout of again go down. Enter buy only on breakout and retest til then bearish will continue.
LTCUSD is at major support and has now broken the resistance and price will likely will move up.
AVAX has recently broken the Support and is likely to reverse from this support area let us see.
HYPEUSD is trading in a symmetrical triangle and price has now reached the support trendline the price may reverse from here to reach the upper trendline resistance .
Currently gold has broken a major trendline and currently trading in bearish momentum, currently consolidating or pullback from support and may get rejected from 0.5 or 0.618 if bearish ahs to continue 3240-3250, if breaks the fib level along with trendline resistance can easily price can reach 3340 major resistance level. let us see.
GBPCHF has formed W pattern at the support and price looks to be reverses after the trendline resistance has been broken the first target will be the fib 0.5 of recent swing high if breaks down then it may go to Fib 1 . let us see
XTIUSd recently pulled back to fib0.5 level and is currently looks to be reversering as support trendline broke and price may reject from here.


