SMC-Trading-Point
PremiumSMC Trading point update Technical analysis of USD/JPY on the 4-hour timeframe, based on a rejection from a key support zone and signs of trend continuation toward a higher target. --- Technical Breakdown: 1. Support Level: Price has bounced from a clearly defined support zone around 146.00 – 146.50, which has held multiple times in the past. This zone...
SMC Trading point update Technical analysis EUR/USD on the 4-hour timeframe, highlighting a structure shift, supply zone rejection, and a move toward a lower support target. --- Technical Breakdown: 1. Market Structure: A clear Change of Character (CHOCH) occurred after the price broke below the recent higher low structure — signaling a bearish trend...
SMC Trading point update Technical analysis of (BTC/USDT) on the 4-hour timeframe, using Smart Money Concepts and a falling channel breakout approach. --- Technical Breakdown: 1. Market Structure: Price has been moving within a descending channel, forming lower highs and lower lows. BTC just bounced strongly from the Fair Value Gap (FVG) zone, marked in...
SMC Trading point update Technical analysis of AUD/USD (Australian Dollar / U.S. Dollar) on the 4-hour timeframe, with a likely setup for further downside. Here's a breakdown of the idea: --- Technical Summary Pair: AUD/USD Timeframe: 4H Current Price: 0.64688 EMA 200: 0.65140 (price is below = bearish bias) RSI (14): 48.23 (neutral to slightly...
SMC Trading point update Technical analysis of Gold (XAU/USD) on the 1-hour timeframe, suggesting a potential short-term sell setup targeting a key support zone. --- Analysis Summary Asset: XAU/USD (Gold Spot) Timeframe: 1H Current Price: 3,371.56 Bias: Bearish pullback toward lower support --- Key Technical Insights 1. FVG (Fair Value...
SMC Trading point update Technical analysis of USD/JPY on the 4-hour timeframe, using a combination of trendline support, key horizontal levels, and EMA 200 confluence to identify a potential bounce. --- Technical Breakdown: 1. Market Structure: USD/JPY experienced a sharp decline from the resistance zone near 150.445, but price is now testing a strong...
SMC Trading point update Technical analysis of (XAU/USD) on the 4-hour timeframe, showing both a potential retracement and a bullish continuation. --- Technical Breakdown: 1. Current Market Structure: Price recently made a strong bullish push from the key support level (~3,329–3,335), breaking structure to the upside. It is now approaching a Fair Value...
SMC Trading point update Technical analysis of Bitcoin (BTC/USDT) on the 4-hour timeframe, with a focus on smart money concepts like FVG (Fair Value Gap) and support/resistance zones. --- Technical Breakdown: 1. Price Structure & Path Projection: BTC is currently in a sideways range, but the drawn projection suggests a potential bullish reversal from the...
SMC Trading point update Technical analysis of USD/JPY on the 4-hour timeframe, with a focus on a support-resistance structure and trend --- Technical Breakdown: 1. Market Structure: Price is moving in a clear uptrend, making higher highs and higher lows. A recent pullback into a support zone suggests potential for a bullish continuation. 2. Key...
SMC Trading point update Technical analysis of Gold (XAU/USD) on the 1-hour timeframe, using a combination of trend lines, EMA, RSI, and price structure. --- Technical Breakdown: 1. Price Structure: Gold is forming a rising channel (black trend lines) within a short-term uptrend, but this is happening below the 200 EMA, which generally indicates bearish...
SMC Trading point update Technical analysis of (XAU/USD) on the 1-hour timeframe, targeting a move toward the $3,310–$3,315 support zone. Here's the full breakdown: --- Technical Analysis – Gold (1H) 1. Fair Value Gap (FVG) Supply Zones Two FVG supply zones are marked where price previously dropped sharply: Upper FVG zone near $3,385.49 (with red...
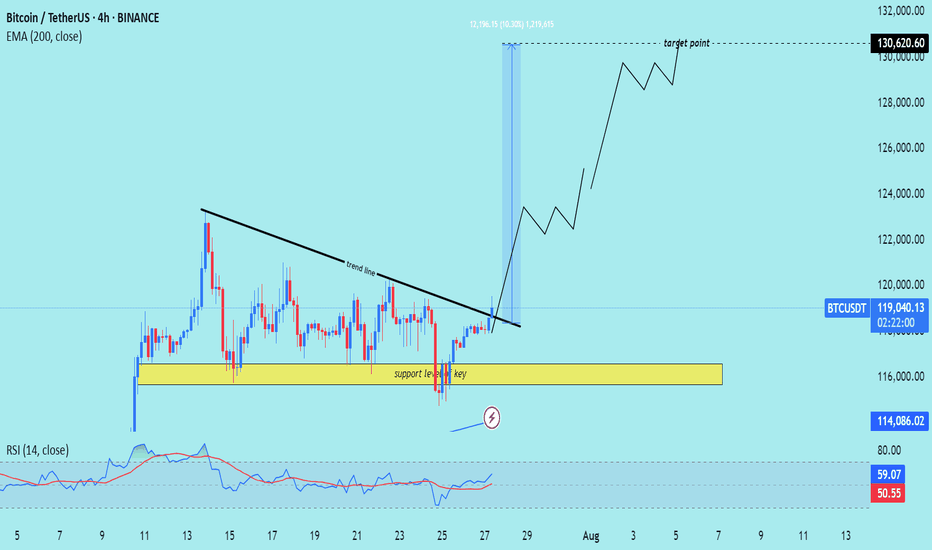
SMC Trading point update Technical analysis of Bitcoin (BTC/USDT) on the 4-hour timeframe, indicating a potential rally toward the $130,620.60 target zone. Here's the detailed breakdown: --- Technical Analysis – BTC/USDT (4H) 1. Key Support Level Holding The yellow zone highlights a strong support zone around $116,000, which has been tested multiple...
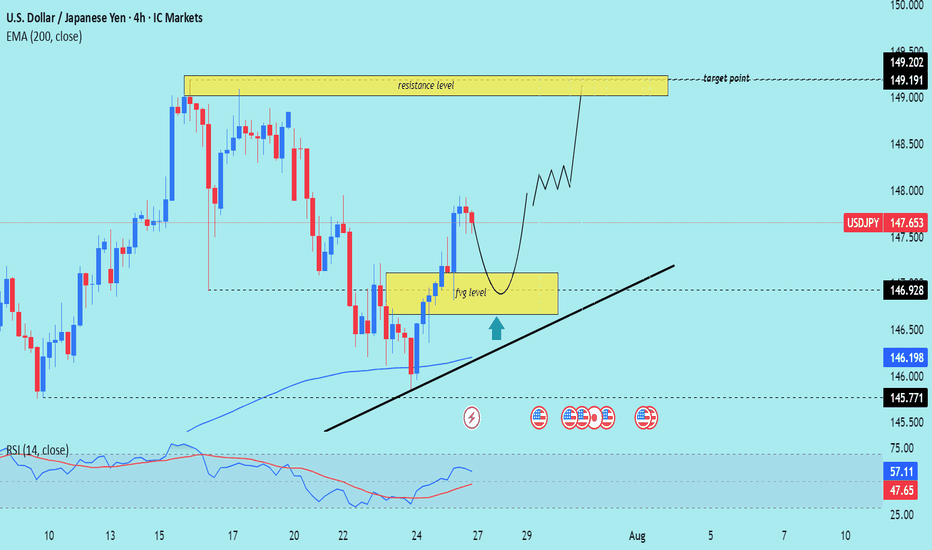
SMC Trading point update Technical analysis of USD/JPY on the 4-hour timeframe, signaling a potential rally toward the 149.191–149.202 resistance zone. Here's the full breakdown --- Technical Analysis – USD/JPY (4H) 1. Fair Value Gap (FVG) Support Price recently filled a Fair Value Gap (FVG) level (yellow box) and is now pulling back toward it. The...
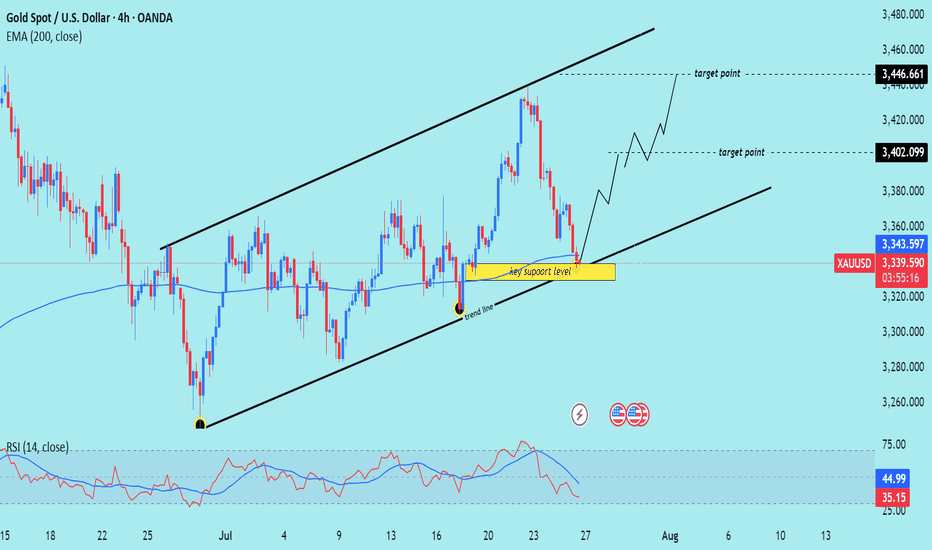
SMC Trading point update Technical analysis of (XAU/USD) on the 4-hour timeframe, indicating a potential bounce from a key trendline support within a rising channel. --- Analysis Summary Pair: XAU/USD (Gold Spot vs. USD) Timeframe: 4H Current Price: 3,338.715 Bias: Bullish rebound within ascending channel --- Key Technical Elements 1. Ascending...
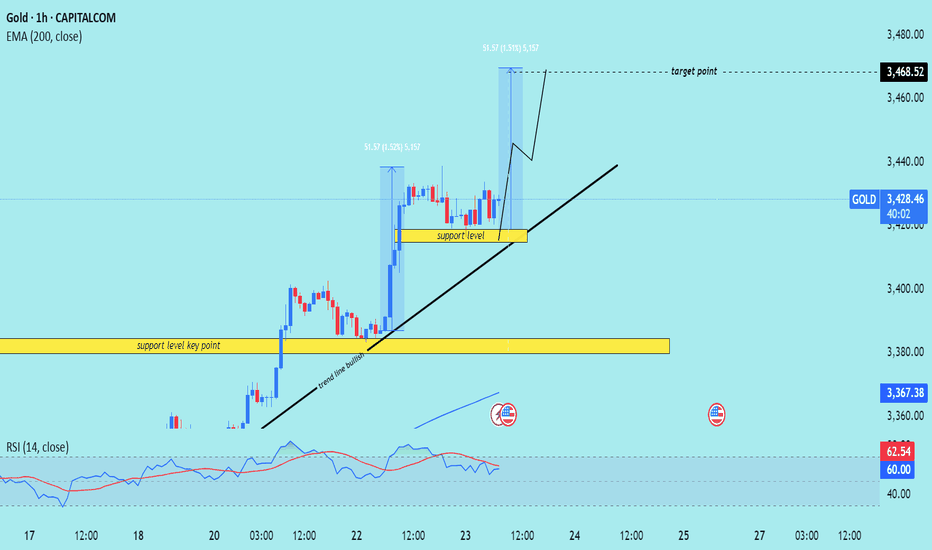
SMC Trading point update Technical analysis of Gold (XAU/USD) on the 1-hour timeframe. Here's a breakdown of the key trading --- Technical Overview Price: $3,428.71 (currently near the upper consolidation) EMA 200: Around $3,367.38 (well below price, indicating strong uptrend) Target Point: $3,468.52 Indicators: RSI (14): 60.19–62.55 → shows...
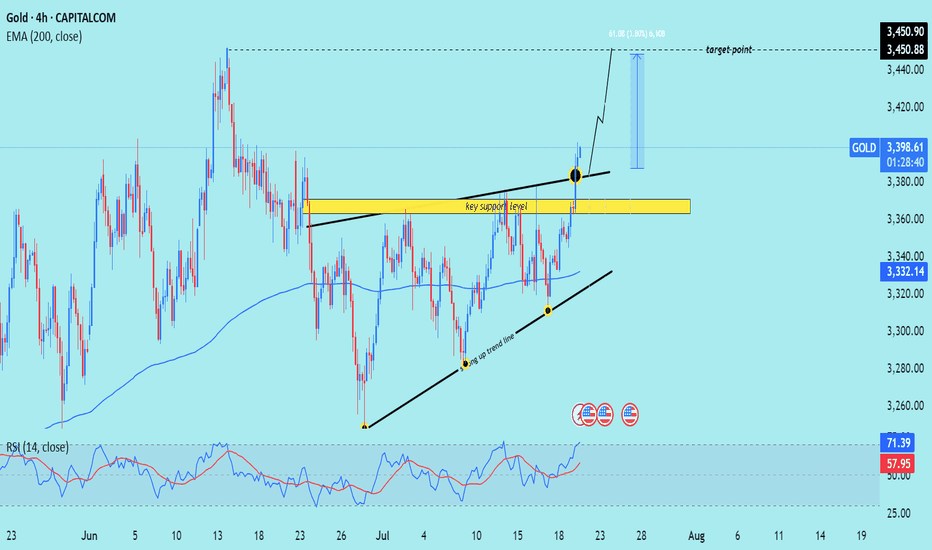
SMC Trading point update Technical analysis of (XAU/USD) on the 4-hour timeframe, highlighting a move toward the $3,450 target. Here's the full technical breakdown --- Technical Analysis – Gold (4H) 1. Breakout from Resistance Zone Price has broken above a key horizontal resistance level (now turned support, marked in yellow). The breakout is confirmed...
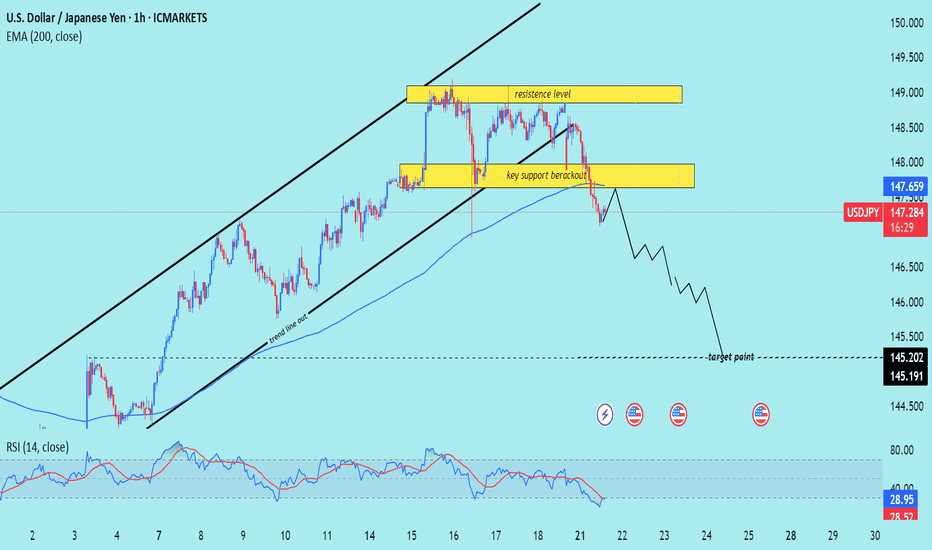
SMC Trading point update Technical analysis of USD/JPY on the 1-hour timeframe, signaling a potential drop toward the 145.200 – 145.191 target zone. Here's the detailed breakdown: --- Technical Analysis – USD/JPY (1H) 1. Rising Channel Breakdown Price has broken below an ascending channel, confirming a trend line breakout and signaling a trend shift...
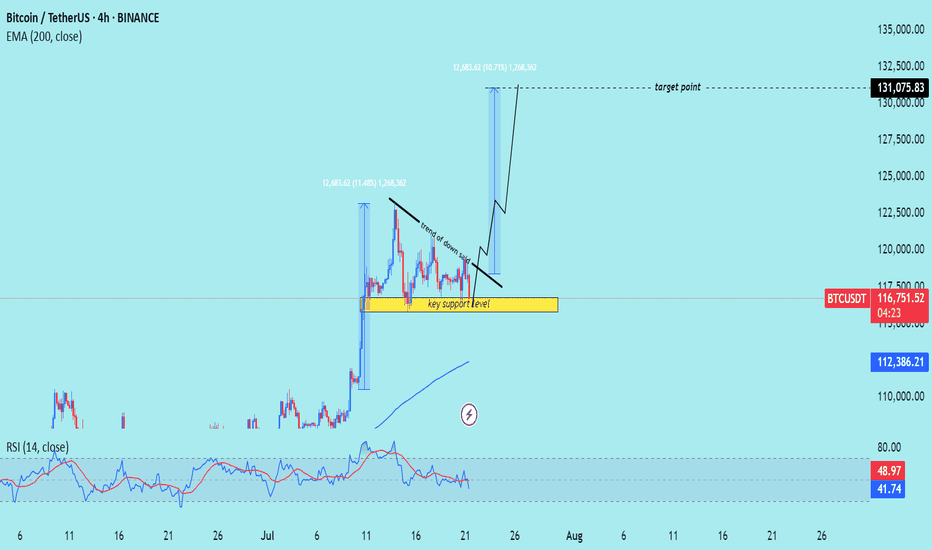
SMC Trading point update Technical analysis of Bitcoin (BTC/USDT) on the 4-hour timeframe, indicating a potential upward continuation after a period of consolidation above a key support level. --- Analysis Summary Pair: BTC/USDT Timeframe: 4H Current Price: 116,810.90 Bias: Bullish breakout continuation --- Key Technical Insights 1. Key Support...


