SMC-Trading-Point
PremiumSMC Trading point update Technical analysis of XAU/USD (Gold) on the 1-hour timeframe. Here’s a breakdown --- Technical Analysis Summary Descending Channel Breakout Price action previously formed a descending wedge/channel, shown by the two black trendlines. A bullish breakout occurred above the trendline, signaling a shift in momentum from bearish to...
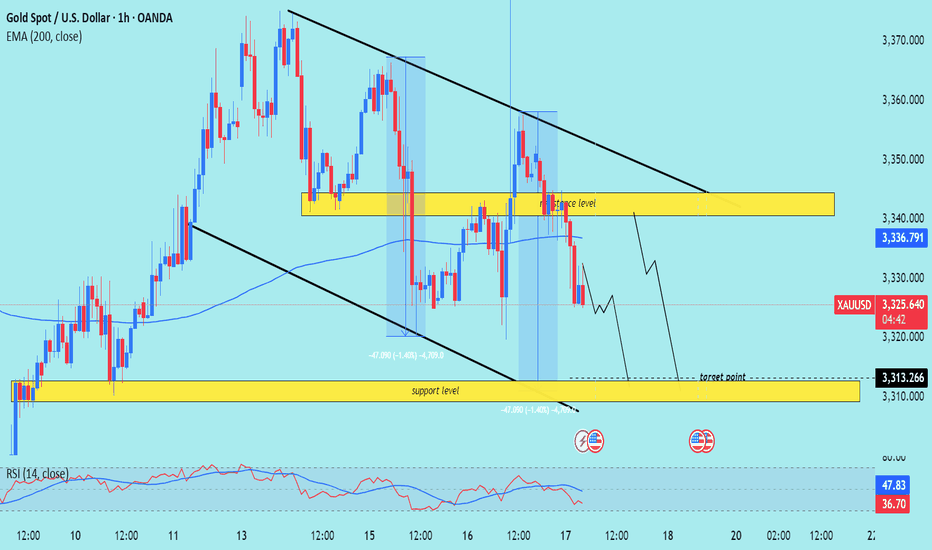
SMC trading point update Technical analysis of XAU/USD (Gold Spot vs US Dollar) on the 1-hour timeframe. Here's a breakdown --- Technical Breakdown: 1. Descending Channel: Price is trading within a clearly defined downward-sloping channel (black trendlines). This suggests a short-term bearish trend. 2. Resistance Zone (Yellow Box at...
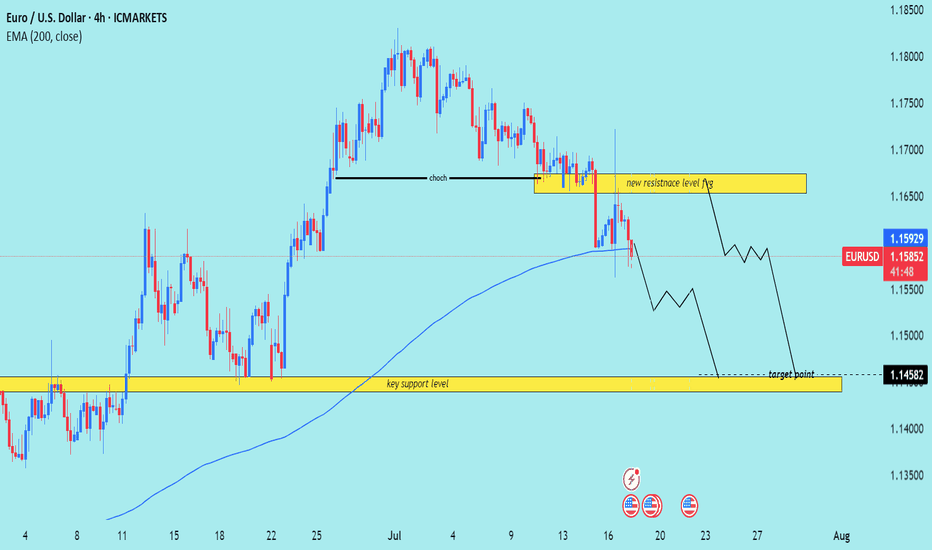
SMC trading point update Technical analysis of EUR/USD (Euro vs. U.S. Dollar) on the 4-hour timeframe. Here’s the breakdown --- Technical Breakdown: 1. Market Structure Shift (CHOCH): The chart highlights a Change of Character (CHOCH), signaling a bearish reversal after a previous uptrend. This is confirmed by lower highs and lower lows forming after...
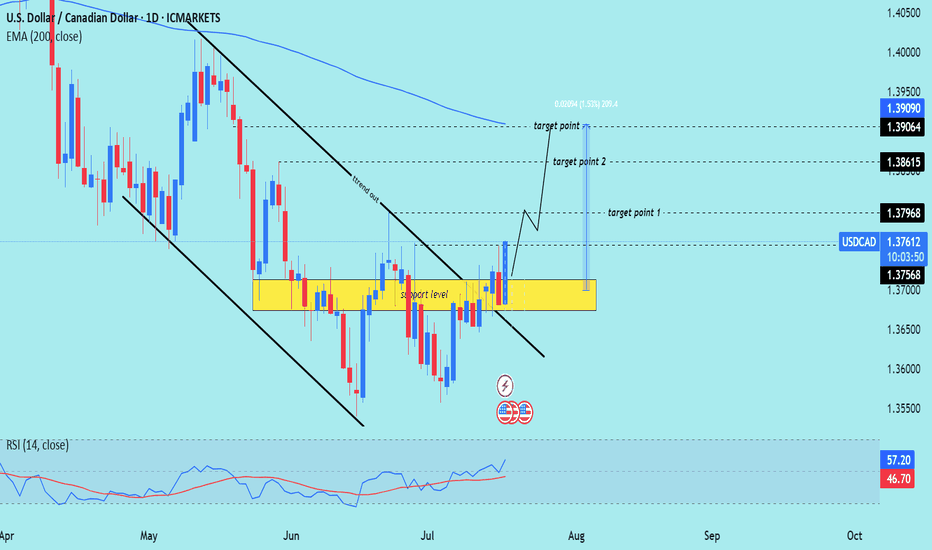
SMC trading point update Technical analysis of USD/CAD (U.S. Dollar vs Canadian Dollar) on the daily timeframe. Here's a breakdown of the trade --- Technical Breakdown: 1. Breakout from Descending Channel: Price has broken out above a descending trend channel (marked with black lines). This breakout suggests a potential trend reversal or at least a...
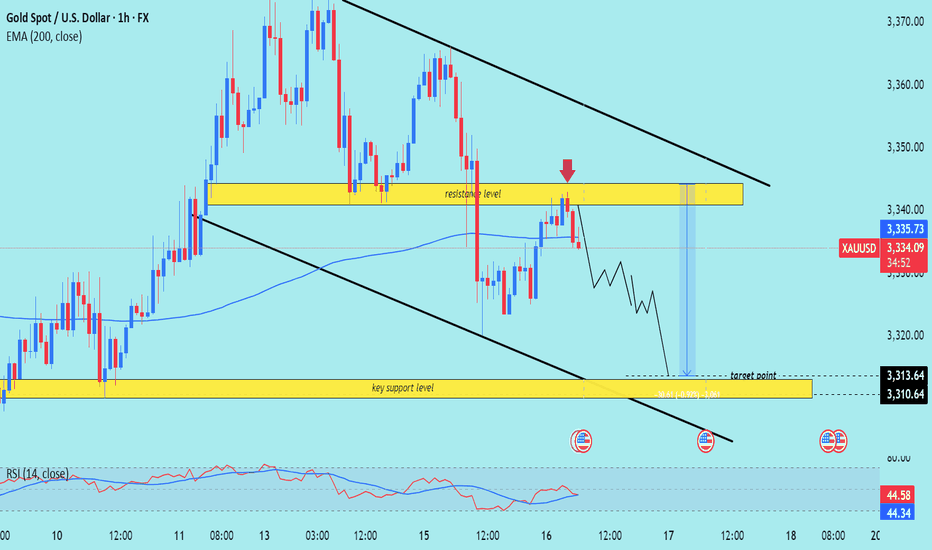
SMC trading point update Technical analysis of XAU/USD (Gold vs USD) on the 1-hour timeframe. Here's a breakdown Technical Analysis Summary 1. Descending Channel: The price is moving within a clear descending channel, indicating a bearish market structure. Recent price action rejected the upper boundary of the channel, strengthening the downtrend...
SMC trading point update Technical analysis of USD/JPY on the 4-hour timeframe, signaling a breakout and possible rally toward the 151.016 target zone. Here's the detailed breakdown: --- Technical Analysis – USD/JPY (4H) 1. Bullish Structure Breakout Price has broken above a long-term resistance trendline, indicating a bullish breakout from a rising...
SMC trading point update Technical analysis of Gold (XAU/USD) analysis on the 3-hour --- Gold (XAU/USD) 3H Technical Analysis Summary Market Structure: Bullish breakout Price has successfully broken above both the downtrend line and the support zone (highlighted in yellow), signaling a shift in structure from bearish to bullish. Key Support Zone: The...
SMC trading point update Technical analysis of (XAU/USD) on the 6-hour timeframe, focusing on a key resistance zone that could trigger either a bullish breakout or a bearish reversal. --- Analysis Summary Current Price: $3,357.95 Trend Context: Price is testing a strong resistance zone with a possible breakout or rejection in play. --- Scenario 1 –...
SMC trading point update Technical analysis of GBP/JPY on the 3-hour timeframe, suggesting a potential short-term pullback within a larger ascending channel. --- Analysis Summary Pair: GBP/JPY Timeframe: 3H Current Price: 198.883 Bias: Bearish move toward channel support --- Key Technical Insights 1. Ascending Channel Formation: Price is moving...
SMC trading point update Technical analysis of USD/JPY on the daily timeframe, highlighting a long-term downtrend reversal with potential for significant upside. --- Analysis Summary Pair: USD/JPY Timeframe: Daily Current Price: 147.442 Bias: Bullish breakout from a descending wedge structure. --- Key Technical Insights 1. Descending Trendline...
SMC trading point update Technical analysis of (XAU/USD) on the 3-hour timeframe, projecting further downside after rejection from a resistance zone aligned with a descending trendline. --- Analysis Summary Trend Bias: Bearish Current Price: ~$3,301.96 Structure: Price is respecting a descending channel, with multiple rejections from the upper boundary...
SMC trading point update Technical analysis of USD/JPY (U.S. Dollar / Japanese Yen) on the 3-hour timeframe, anticipating a rejection from a descending trendline resistance and a move down toward key support levels. --- Analysis Overview: Trend Bias: Bearish correction expected Structure: Price is reacting at a descending trendline, which has held as...
SMC trading point update Technical analysis of USD/CAD (U.S. Dollar / Canadian Dollar) on the 1-hour timeframe, with a focus on a potential double-top formation at strong resistance, followed by a drop toward support: --- Analysis Overview Trend Structure: Downward-sloping channel with lower highs and lower lows. Confluence Area: The current rally is...
SMC trading point update Technical analysis of Gold (XAU/USD) on the 1-hour timeframe, focusing on a potential reversal from a key support/order block zone. Here's a full breakdown --- Chart Analysis – XAU/USD (1H) 1. Key Zone: Support Level / Order Block (Yellow Box) The price is currently testing a strong support zone that previously acted as a bullish...
SMC trading point update Technical analysis of Gold (XAU/USD) on the 3-hour timeframe, suggesting a long trade idea with a clearly defined support zone and target projection. Here's the detailed breakdown: --- Chart Breakdown (3H - XAU/USD) 1. Support Zone (Yellow Box): Price reacted strongly to the 3,244–3,300 area, which is identified as a key support...
SMC trading point update Technical analysis of USD/CAD pair on the 2-hour timeframe, suggesting that the price is likely to drop toward the support zone. Here's the detailed idea behind the analysis: --- Chart Breakdown (2H – USD/CAD) 1. Resistance Zone (Yellow Box - Top): Marked as a strong supply area where price has repeatedly been rejected...
SMC trading point update Technical analysis of USD/JPY pair using a combination of price action, resistance/support levels, and indicators. Here's a breakdown of the idea behind the analysis: --- Chart Breakdown (2H - USD/JPY) 1. Key Zones: Resistance Level (Yellow Box at Top): Price has previously been rejected from this zone multiple times. Recent...
SMC trading point update Technical analysis of USD/JPY (U.S. Dollar vs Japanese Yen) on the 1-hour timeframe. Here's a clear breakdown of the idea presented: --- Overview of the Setup Current Price: 144.620 EMA 200 (Blue Line): 144.973 – price is trading below the EMA, indicating bearish momentum. Resistance Zone: Around 145.000 –...


