Sahrin
PremiumPrice has closed below the middle Bollinger Band (blue line), indicating bearish pressure. Recent candles show rejection wicks on top and strong red-bodied candles, signaling active selling. Support zone around $0.40 has been breached and price is struggling to reclaim it.
The price is trading below the midline of the Bollinger Bands, indicating weakness and bearish momentum. Recent candles show lower highs and lower lows, a classic bearish structure. Price has rejected the midline recently and is leaning back toward the lower band, a common setup in bearish continuations.
DOT is trading above the 20-day moving average (middle band of the Bollinger Bands), which is a bullish signal suggesting upward momentum. If price holds above the middle Bollinger Band, the bullish bias remains intact. A close below it could weaken the short-term bullish case. Key support: $4.20–$4.00 Key resistance: $4.60 (break above confirms continuation)
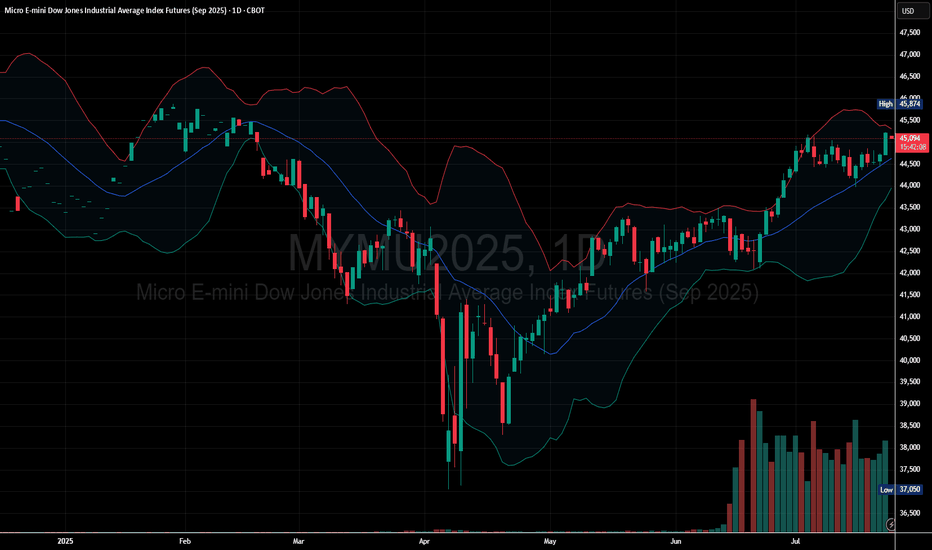
Price is riding the upper half of the Bollinger Band. Price recently bounced from the middle band, a bullish continuation signal. Multiple bullish candles with small upper wicks, showing buyers are in control. Recent pullbacks have been shallow, indicating strong buying interest on dips.
Price Above Moving Average: The current price is trading above the midline of the Bollinger Bands, showing bullish momentum. Bands Expanding Upward: The Bollinger Bands are sloping upward, indicating increasing volatility in the direction of the trend. Price near Upper Band: Price is near or hugging the upper band, which often signals strong bullish...
The price is trading below the middle Bollinger Band (20-day SMA), which is sloping downward. Lower highs and lower lows pattern confirms the bearish market structure. Price hugging the lower band or staying in the lower half of the band zone — a classic sign of weakness. Price repeatedly fails to close above the middle band (~20-day SMA), confirming it as...
The most recent candle closed below the middle Bollinger Band (20 SMA), indicating potential downside momentum. The price recently spiked toward the upper band (~$4.20) but was strongly rejected, creating a bearish reversal pattern. Volume has been increasing on down days, especially the last few sessions, suggesting institutional selling pressure.
Recent candles are large-bodied bearish candles, indicating strong selling pressure. Bollinger Basis is sloping downward, showing short-term bearish momentum. Price is currently below both the 20-day and 50-day moving averages, reinforcing the bearish outlook.
The current price has closed above the Bollinger Band middle line (20-day SMA), indicating short-term upward momentum. A sustained close above 4.90–4.95 could open the way to challenge the psychological level of 5.00 and possibly 5.20. Immediate resistance: 4.95 → 5.00 → 5.20 Support zones: 4.75 (middle band) → 4.60 (recent low) → 4.45 (lower band)
Price is riding the upper band, a classic signal of strong bullish trend continuation. Strong support near $34.50–$35.00 (prior consolidation zone and Bollinger midline). Psychological support at $36.00 which was broken and now may act as support-turned-resistance.
Downtrend in progress: The price is making lower highs and lower lows, confirming a bearish market structure. Price below key moving averages: The candles are trading below the midline of Bollinger Bands and the moving average, indicating sustained bearish pressure. Resistance near $0.55–$0.60: Previous support now turned resistance, tested and rejected...
The price is trading in the lower half of the Bollinger Bands, suggesting weakness. Support Levels: Around $0.85 - $0.90 (Recent lows) Resistance Levels: Around $1.00 - $1.10 (Bollinger mid-band & psychological level) Bearish Bias: The price remains below the moving average and in the lower Bollinger Band range. Potential Reversal: If price breaks above...
Lower Highs & Lower Lows: The price consistently prints lower highs and lower lows, confirming a bearish structure. The price is moving along the lower band, indicating persistent bearish pressure. The middle band (moving average) is acting as a resistance level. Support: Around $0.20 - $0.21 (current price zone), as it appears to be stabilizing near the...
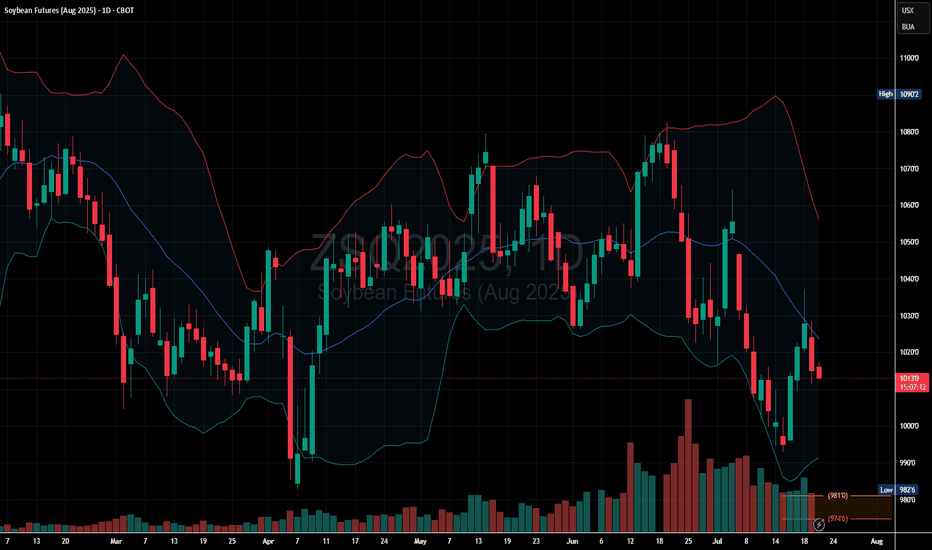
The current price is trading below the midline of the Bollinger Bands (usually a 20-day moving average), which typically indicates downward momentum. The chart shows a pattern of descending highs and descending lows, which is a classic bearish structure. The latest candle is red and pushing toward or near the lower Bollinger Band, suggesting increased selling...
The last few candles show strong red bodies, suggesting selling pressure. Price has closed below the middle Bollinger Band (20-day moving average), often a trigger point for downside momentum. This suggests a transition from neutral/bullish to bearish momentum. Recent highs failed to break the previous peak near $2,900. This forms a lower high, indicating...
Price is now trading above the 20-day and 50-day SMAs, which suggests bullish momentum continuation. Immediate support lies around $2,400–$2,500, near the 20-SMA and recent swing lows. Resistance is near the $2,800–$2,850 zone, which is a previous high from the current range. The recent candles are small-bodied, suggesting low volatility and indecision,...
The price is currently trading below the middle Bollinger Band, which is typically a 20-day simple moving average. This indicates weakness and suggests that the short-term trend is turning bearish. After the sharp rebound in April, price has been unable to make new highs. The chart shows a lower high structure, indicating diminishing bullish momentum. The...
The current price ($3.692) is trading below the 20-day simple moving average (middle Bollinger Band), indicating short-term weakness. This often suggests bearish momentum when combined with a failure to close above the mid-band. In early May, price touched or neared the upper Bollinger Band and was rejected. This indicates strong selling pressure and the...


