Gold is currently trading within a rising wedge pattern on the 1-hour chart. The price recently touched the upper trendline of the wedge and faced a strong rejection, indicating bearish pressure. If the price breaks below the lower boundary of the wedge, it will likely trigger a sharp bearish move. Key downside targets after a confirmed breakdown...
US30 M30 chart bullish flag pattern Buy: current rate 44238 Stop Loss: 44125 1st TP: 44388 2nd TP: 44570
NZDUSD hourly chart double bottom formation confirmed. Buy above: 86.95 Stop Loss: 86.65 1st TP: 87.30 2nd TP: 87.50 If break 87.50 level then next target 88.00 and 88.30.
USDCAD has recently completed a clean 5-wave Elliott Wave decline, reaching a significant low at 1.3540 on June 16, 2025. This low marks the end of the bearish cycle, followed by an accumulation phase. During this phase, price formed a triple bottom pattern, confirming strong demand around the 1.3540–1.3560 zone. The breakout above the neckline confirms this...
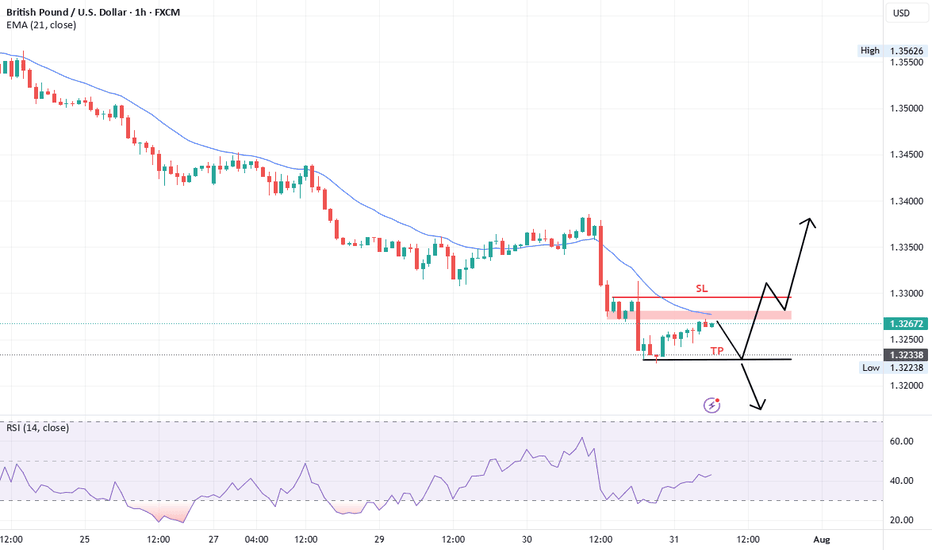
GBPUSD rising trendline break and retest falling trend line finnly breakout triangel. Sell below: 1.3275 Stop Loss: 1.3305 1st target: 1.3250 2nd target: 1.3215 FOREXCOM:GBPUSD
XAUUSD M15 create double doji evning shoting star. Sell below: 3361.00 Stop Loss: 3364.00 1st TP: 3355 2nd TP: 3351 3rd TP: 3347 4th TP: 3341 If breakout rising trendline and 3340 then gold more downward move 3330, 3318 and 3302.
Gold is currently consolidating inside a triangle pattern. After a recent bullish rally, price retraced between the 61.8% – 76.4% Fibonacci levels, finding support and bouncing upward. At present, gold is facing resistance at both the falling trendline and the 3298–3300 zone. Bullish Scenario: A breakout above the resistance trendline and the 3298–3300 zone...
XAUUSD breakout falling channle and resistance zone. Buy above 3295 Stop Loss: 3291 1st TP: 3308 2nd TP: 3313 3rd TP: 3322 4th TP: 3333
EUR/USD is currently trading within a Descending Triangle formation. At present, the pair shows a higher probability of an upside breakout from this structure. A confirmed break above the immediate resistance zone at 1.1428 – 1.1430 could accelerate bullish momentum, opening the way toward the next key resistance level at 1.1485. On the other hand, if the pair...
Bearish Wedge Breakdown: The price was consolidating in a descending triangle / wedge pattern. It has now broken below the wedge, suggesting potential bearish continuation. Key Support Zones: Immediate support near 68.60 - 68.80 (highlighted in blue). FOREXCOM:USOIL The break of the 68.60 level with a strong bearish candle would serve as ...
Trendline Breakout: Price has decisively broken above a short-term descending trendline, signaling a potential shift in intraday momentum from bearish to bullish. Support Zone (1.3185 – 1.3195): This demand area has provided a strong base, with multiple successful rejections confirming buyer interest. Resistance Levels: Near-term resistance: 1.3213...
Currently, Silver is trading inside a symmetrical triangle formation , signaling a potential breakout. Upside Scenario: A breakout above 36.80 resistance may trigger strong bullish momentum. The next target zone lies at 37.18 – 37.30, which is a relatively weak resistance and could potentially form a Head and Shoulders pattern . If momentum continues,...
FOMC Press Conference and USA Fund rate same Sell 1.3270 Stop Loss 1.3295 TP 1.3235
Sell below 3302-3304 Stop Loss 3309 Targets 3288 3275 3268 3255
US30 recently bullish rally complete now time to start retrace 50% and 61.8% at least touch, after this retrace then new bullish move start. Reason for sell evening star. Sell Current price Stop loss 35790 target 50% and 61.8%.
Daily chart this week break bullish wedge with 61.8% retrace level touch. Weekly chart
XAUUSD right now emerging continuation patterns. Gold buy 1954 Stop loss 1948 target 1975 and 1983.
USDJPY break following trendline now retest support level 130.60 Buy 131.20 Stop loss 127.30 Targets 134.60, 137.90 and 142.00....


