Shalvisharma5
EssentialWe are tracking a possible double-top pattern here (4 hr timeframe) Bearish Case: If price fails to sustain above resistance and later breaks support (252–256) → confirmation of double-top → downtrend likely to follow. Entry 263 Target 268 - 271 Invalidation: sustains above resistance, the double-top setup is invalid. (SL 257) Bullish continuation may extend...
Crude Oil (1H timeframe) broken out from its short-term downtrend channel and is now retesting key resistance near 5740. Price is holding above the 5610 support, but upside is likely capped unless bulls sustain momentum. 🔹 Key Levels: • Resistance: 5740 – 5770 • Support: 5610 → 5513 📊 Technical View & Trade Plan: • Sell Zone: 5730 – 5770 (near trendline...
Timeframe: 1H Breakout Watch 🚀 Technical Overview: Natural Gas is testing key horizontal resistance around 272 after multiple rejections. Price is holding above 25 EMA and 55 EMA, showing short-term bullish momentum. Key Levels to Watch: • Resistance: 272 – 274 • Breakout Target: 278 – 280 (if sustained above 274) • Support: 266 – 264 zone Trade...
SILVER | 1H TIMEFRAME Price is breaking out of the falling wedge + forming a cup-type rounded bottom from support. 📊 Technical Overview: • Cup formation breakout spotted ✅ • Price attempting to sustain above falling wedge resistance • 55 EMA & 25 EMA crossed bullish • Volume buildup visible • All-Time High Resistance remains at 116664 (HTF) 📍Key...
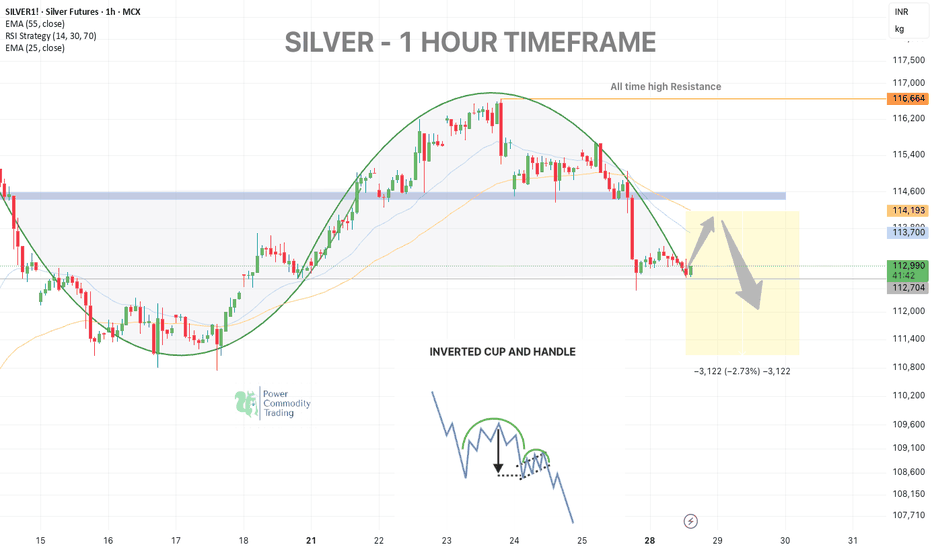
📉 SILVER – 1H TIMEFRAME - Inverted cup and handle pattern Silver tested support around 112,800–113,000 after a rounded top formation, rejecting the key EMA zones (25 & 55) and the previous demand-turned-supply zone. 🟠 Scenario Unfolding: Expecting a short-term bounce towards 113,750–114,200 (EMA cluster zone) — this could act as a dead cat bounce, offering an...
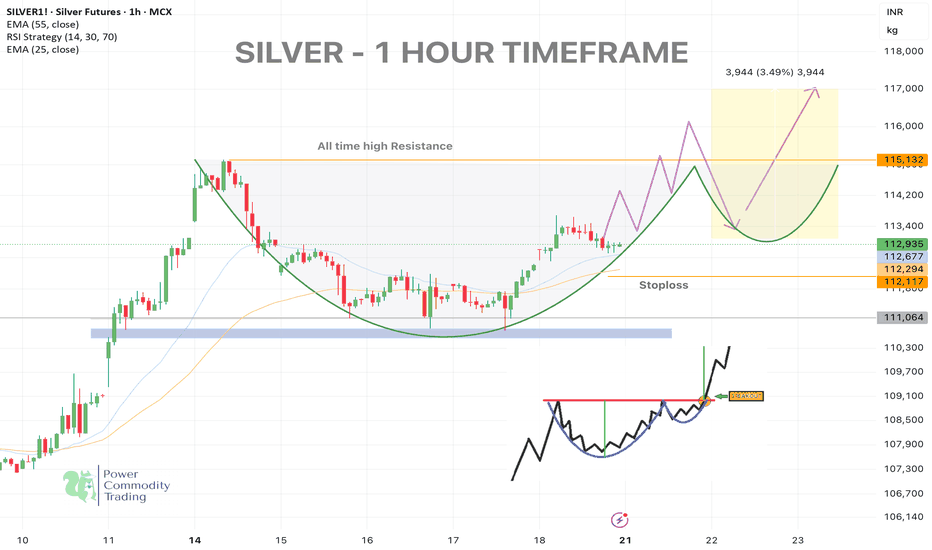
Silver (MCX: SILVER1!) – 1 Hour Chart Analysis 🔍 Pattern Formation: Cup and Handle + Rounded Bottom Silver has formed a classic Cup and Handle pattern on the 1H timeframe, indicating a potential bullish breakout above the neckline near 115132 (all-time high resistance). A smooth rounded bottom confirms strength in accumulation. 📈Bullish Signals Observed: ...
Pattern formation: falling wedge pattern (4 Hour) Price executed a clean reversal from the demand zone, reclaimed key EMAs, and broke out of the falling channel — hinting at a potential trend shift on the mid-timeframe. ✅ Support zone held strong near 270–280 ✅ Breakout of falling wedge/channel ✅ Reclaim above 25 & 55 EMA ✅ Bullish structure with clean...
🛢 CRUDEOIL – Weekly Outlook (4H Timeframe) Published by: Shalvi Sharma (Power Commodity Trading) Crude is trading around 5568 and approaching a crucial triangle breakout zone. ⚠️ Key Levels: Breakout Resistance: 5600 – 5675 Bearish OB Zone: 5675 – 5800 Immediate Support: 5374 (EMA55) Demand Zone: 5180 – 5270 🔍 Technical Outlook: Price is compressing...
NATURALGAS – Weekly Update Timeframe: 1HR | Symbol: NATURALGAS1! (MCX) Pattern : D Cup Formation Completed Natural Gas has formed a textbook "D Cup" pattern, indicating a rounded top reversal structure. After a parabolic rise in late April, prices have gradually given up gains, confirming the pattern with a breakdown toward 270. Resistance Zone: 295 –...
📈 NATURAL GAS – 1H TIMEFRAME UPDATE Natural Gas has been climbing nicely inside an upward channel, and right now it’s retesting the lower trendline after a strong rally last week. 🔸 Support zone: Around 306–307 (channel bottom) 🔸 EMA 55: Acting as dynamic support near 300 -295 🔸 Volume: Picking up on the recent dip — worth watching! 🔍 What to Look Out For: ✅ If...
SILVER - 4H Timeframe Update Price is nearing the apex of a symmetrical triangle formation. Momentum is gradually building with higher lows supporting the structure. As per news: Silver slipped slightly by 0.5% to $33.37/oz, following gold's rebound after a sharp drop. Despite global trade tensions and weaker dollar aiding gold recovery, silver underperformed,...
📈 CRUDEOIL – 1 HOUR TIMEFRAME ANALYSIS CrudeOil is currently testing a key resistance zone near 5995–6000. Price action has respected the rising trendline, and the structure looks poised for a breakout or rejection move. 🔍 Two Possible Scenarios: 🔹 Bullish Breakout Above 5995 If crude sustains above 5995 with volume confirmation, we may see a sharp move...
Crude oil is testing the lower trendline of the symmetrical triangle on the 1-hour timeframe, showing increasing selling pressure. 🔹 Bearish Scenario: A break below 5820 can trigger further downside, leading to targets around 5780 - 5750 - 5700. 🔹 Bullish Rebound: If the support at 5860 holds, a bounce toward 5900 - 5930 is possible. 📊 Watch price action...
📊 Natural Gas Detailed Analysis – 1HR Timeframe 📊 Pattern Formation & Breakout Potential: Natural Gas has been trading within a falling wedge pattern, a bullish reversal structure, indicating potential upside momentum. A breakout attempt is visible as the price is trying to sustain above the wedge resistance. Key Observations ✅ Resistance Zone: 343 - 345...
🚨 Crude Oil (MCX) 4 HOUR Chart Analysis 🚨 🔹 Bullish Indicators Identified: Breakout from a descending trendline, signaling potential trend reversal. Price reclaiming the 55 EMA (6211) as a key resistance level. 🔹 Expanding Demand Zone: The breakout structure suggests a shift in market sentiment, increasing the probability of bullish continuation. 🔹 Target...
Crude Oil (MCX) 1HR Chart Analysis 🔹 Expected Price Movement: Price is forming a rising wedge pattern, indicating a potential short-term upmove before a breakdown. 🔹 Bullish Push First: Expecting price to test the 6343 - 6380 zone before showing weakness. A temporary breakout could occur before reversal. 🔹 Bearish Breakdown Target: If the price fails to hold, a...
The chart highlights a Descending Triangle formation, a bearish continuation pattern suggesting potential downside momentum if the support breaks. Resistance Zone: 6310 (aligned with the upper boundary of the triangle). Support Levels: T1: 6280 - T2: 6250 - T3: 6200 Bearish OB (Order Block): The price recently tested the Bearish Order Block near 6,310,...
Silver Update: Key Levels to Watch Timeframe: 1 Hour Current Price: 92300 Key Levels: Resistance: 92400 (78.6% Fibonacci) Support: 91400 (61.8% Fibonacci) Scenarios: 1️⃣ Breakout Above 92450: Bullish move toward 93550 - 93750. 2️⃣ Rejection from 92450: Possible pullback to 91400 support. Action Plan: Wait for a breakout confirmation or rejection for...


