These are short term key levels on 1h chart 117 134 147 156 165 176 195
These are short term key levels on 1h chart 583 645 726 760 802 869
These are short term key levels on 1h chart 566.45 517.48 487.19 462.7 438.22 403.36 358.95
These are short term key levels on 1h chart 1.58 2.26 2.74 3.22 3.85 4.78
These are short term key levels on 1h chart 2.74 3.23 3.57 3.9 4.22 5
This is Gold channel on 1H chart it is showing support and resistance levels. If Gold cross this channel then an strong trend could be possible.
These are short term key levels for intra day and swing trading on 1h chart. 1.3795 1.3541 1.3384 1.3264 1.3129 1.2948 1.2718
These are short term key levels for intra day and swing trading on 1h chart. 1.0718 1.0973 1.1158 1.1288 1.1418 1.1578 1.1838
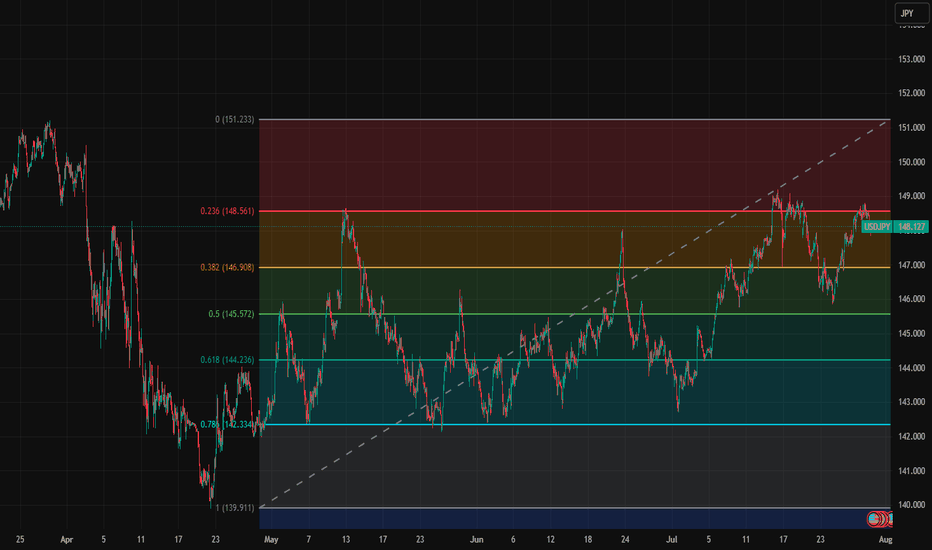
These are short term key levels on 1h chart for intra day and swing trading. 139.91 142.33 144.23 145.57 146.91 148.56 151.233
These are gold key levels for short term or intra day and swing trading. These are on 1h chart. 3290 3325 3350 3372 3402 3452
With strong fundamentals it was grown rapidly in last few days. Today it was in bearish trend but with very less volume, we can say it correction, profit taking of rollover week and month closing. These are key levels 15.45 13.68 12.59 11.71 10.82
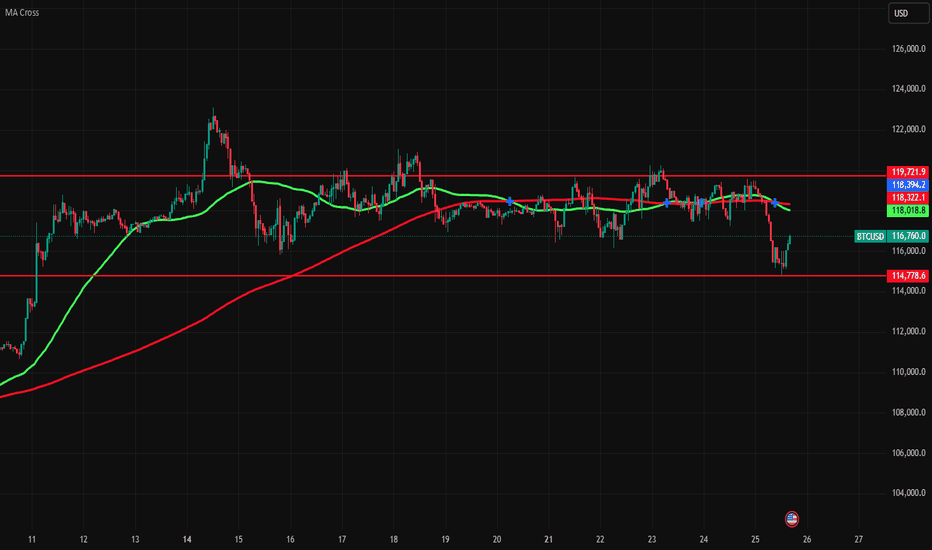
This is BTC zone where it is moving since few days. It is below golden cross on hourly chart. It could be cross this zone after crossing golden cross.
These are Gold key levels on Hourly Chart 3246 3287 3320 3343 3365 3393 3438
These are Aapl key levels 154.29 176.77 192.55 208.34 227.87 259.49
These are Tesla key levels 249.44 295.01 340.58 396.97 488.12
These are Reliance key levels 1113.8 1219.5 1360.85 1419.15 1491.3 1607.9
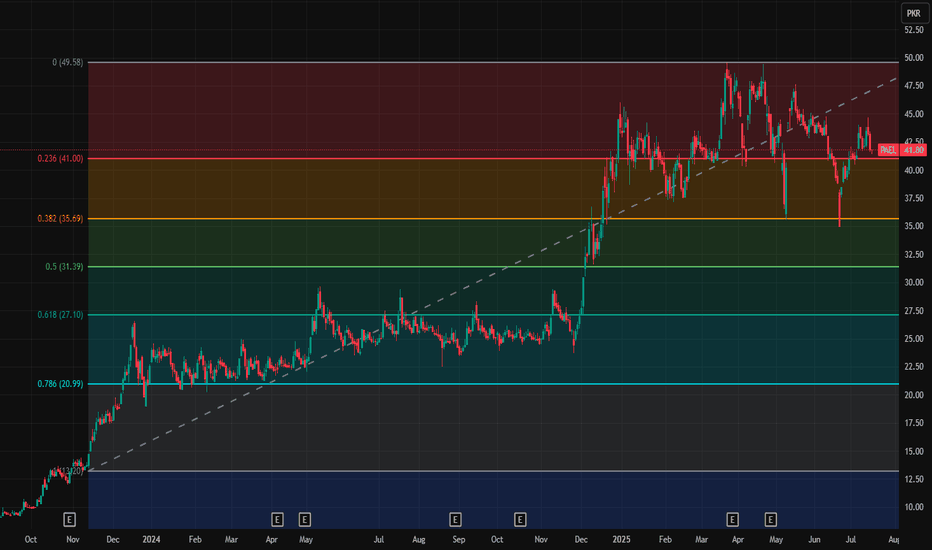
These are Pael key levels 31.39 35.69 41 49.58 Note: This is not a buy/sell trade call. It is an analysis.
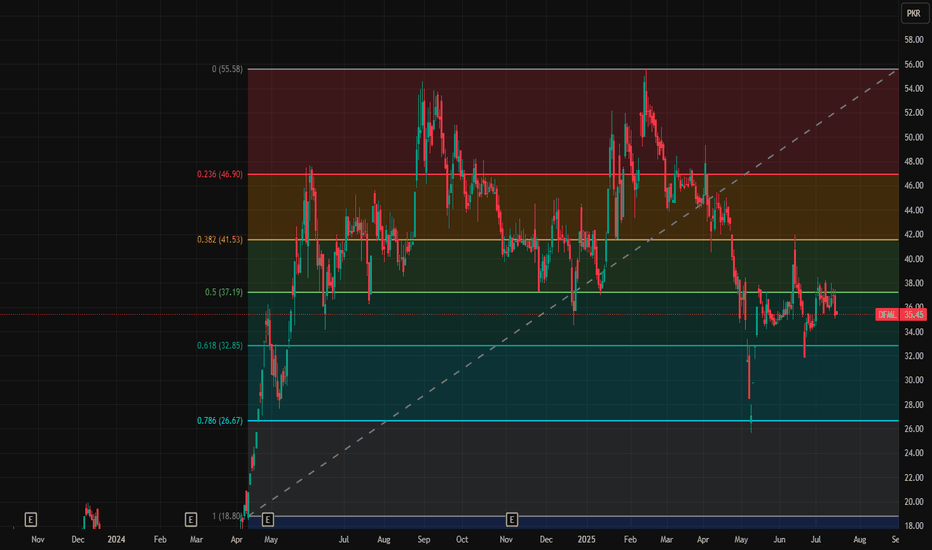
These are key levels of DFML 26.67, 32.85, 37.18, 41.53, 46.9 and 55.08 Note: This is not a buy/sell trade call, it is an analysis.


