SinoheTrader
The Avaxusdt is in the two areas, one of the supports is 618, the corrective wave before, and one is dynamic support. If supported, it can rise to 0618.
Hi guys, this is my overview for BTCUSD, feel free to check it and write your feedback in comments👊 The price reversed its prior downtrend with a decisive breakout from a falling channel. This breakout triggered a strong upward impulse, which then began to consolidate into a large symmetrical pennant. However, the price recently failed to hold the lower support...
The CAKEUSDT currency is in a good position on the weekly timeframe near long-term dynamic resistance. Considering the RSI and trading volume, the probability of breaking this resistance is high.
Bitcoin on the monthly time frame. If the monthly candle closes in this way, the price is expected to move to the 618 Fibonacci area. According to the trend line in RSI, we will enter a correction phase after the price rises.
** Shares of U.S. homebuilders slide on Weds after Fed chair Powell says no decision yet on rate cuts ** Markets now pointing to odds dropping below 50% that the Fed will cut rates at its next meeting in Sept, as benchmark U.S. 10-year yield US10Y extends rise ** Rising yields can potentially lead to higher mortgage rates, which could negatively impact...
The situation is similar to the news tonight, the Federal Reserve interest rate
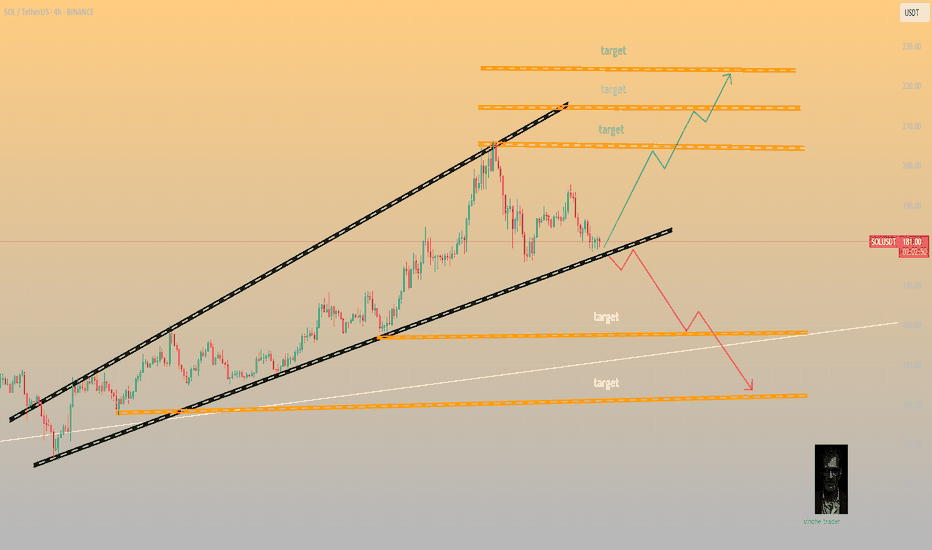
SOL Both scenarios are valid! SOL is still bullish SOL is in a critical zone. The price is still inside a large bullish pattern and as long as it stays inside the pattern, the trend remains bullish and SOL should follow the bullish scenario. The bullish targets are at 205, 214 and 224 It may happen that the FOMC will bring surprises, so if SOL manages to break...
Bitcoin is still in correction, but is rebounding from the local low of 117.4, formed during the pullback, and is heading back up towards the zone of interest at 119.8-120.1, which it did not reach during the main upward movement. I see no fundamental or technical reasons for the correction to end and for growth beyond 121K. I expect a rebound from the resistance...
AVAXUSDT retraced sharply from the 27.34 resistance zone after making a higher high but found support above the descending trendline. The recent corrective move has paused at a key structure level near 24.96, hinting at potential bullish continuation. A breakout above this local resistance could trigger a rally toward the 26.50–27.34 target zone. Momentum builds...
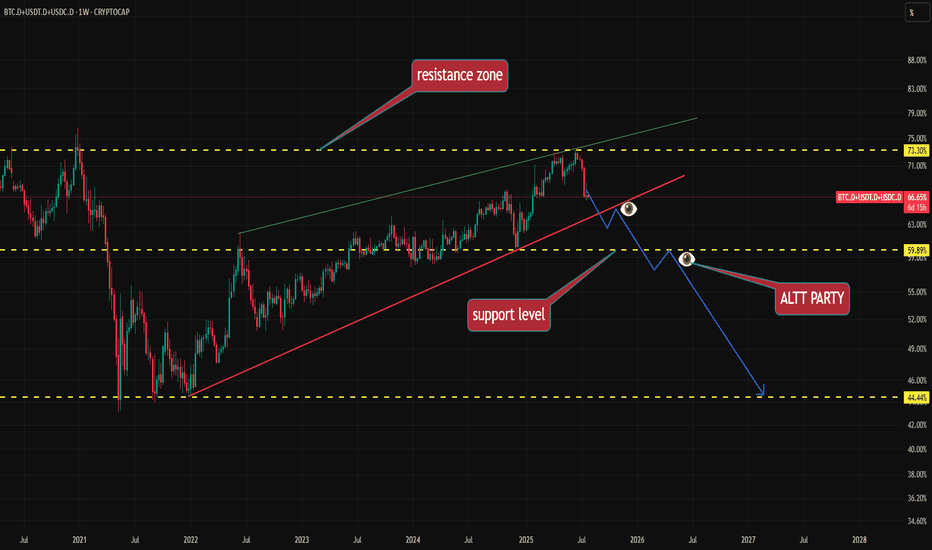
The NFCI index for identifying ALT season is one of several indDEX derived from, among others, the Federal Reserve interest rate.
The best tool for detecting the start of the Alt Season is a combination of three important indicators: Bitcoin Dominance, Tether Dominance, and USDC Dominance.
BTCUSDT has failed to break through the descending resistance near 120,000 and is now forming a lower high within the broader resistance zone. The price action follows an impulsive leg up and is currently tracing a potential reversal pattern under key structural resistance. As long as the market remains capped below 120,000, continuation toward 117,500 is likely....
💲💲 #ETH is trading between support and resistance area. There is a potential rejection again from its resistance zone and pullback from support zone. If #ETH breaks the major resistance zone then we would see a bullish move
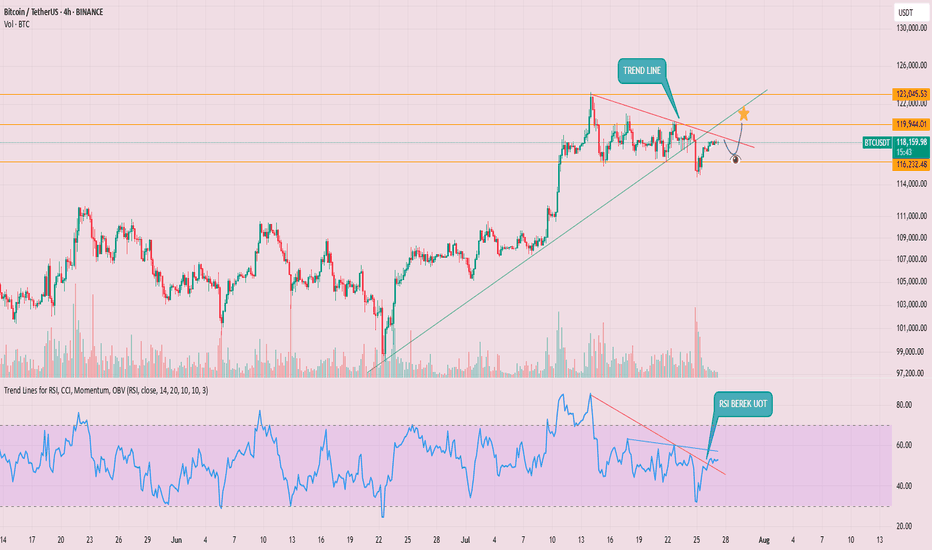
The dynamic trend line RSI was broken, you can enter a long trade after the pullback.
HYPEUSDT is bouncing from a higher low near the 42.070 zone after breaking a descending flag pattern. Price action remains above the ascending support trendline while pressing into a key structure retest. As long as HYPE stays above 42, a bullish leg toward the 49.700 resistance remains likely. Structure suggests a resumption of the impulse phase within the...


