Sphinx_Trading
PremiumUSD/JPY Weekly Forecast – July Week 4 Last week, USD/JPY retested a weekly Fair Value Gap and closed with strong bullish pressure, confirming demand. Now, the next key liquidity level sits around 151.00 — just above the previous major highs. On the daily timeframe, we may see a bearish retest toward 147.00 early in the week. From there, supported by both Federal...
Gold Weekly Forecast – July Week 4 Gold closed last week with a strong bearish weekly candle, rejecting from the 3,440 supply zone and closing below the key Fair Value Gap at 3,360. This confirms downside pressure, especially in the context of a strengthening dollar. For this week, we may see a bullish opening early in the week toward 3,370, followed by a deeper...
GBP/USD Weekly Forecast – July Week 4 Last week, GBP/USD retested a weekly Fair Value Gap near 1.35900 and responded with a strong bearish engulfing candle — showing clear rejection from the imbalance zone. With the dollar expected to strengthen this week, we could see a small bullish retracement early in the week toward 1.35000, followed by a bearish swing move...
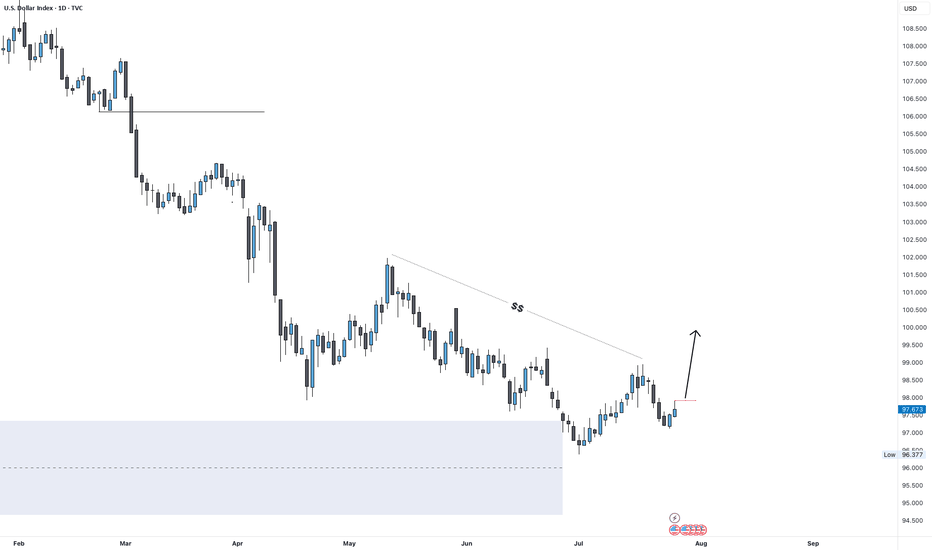
DXY Weekly Forecast – July Week 4 After reaching 96.50 early this month, DXY began showing bullish signs. Last week, price retested the extreme demand zone at 97.00 and closed with a bearish weekly candle that held some bullish pressure at the base. This week, all eyes are on the Federal Reserve meeting. If the Fed holds rates steady, the dollar could strengthen...
EUR/USD Weekly Forecast After a major and minor sweep near 1.1150, EUR/USD closed two consecutive bearish weeks, signaling a clear shift in momentum. Last week also confirmed a change of character, creating liquidity around 1.1270 and forming a daily Fair Value Gap at 1.1370, which has now been filled. We expect the week to open bearish, targeting: • 1.0900...
Gold Weekly Forecast Gold closed last week below the previous weekly lows at 3,260, confirming bearish intent. Price has now left behind multiple imbalances from the bullish leg that started at the 3,000 level. We could first see a retracement to the small imbalance zone around 3,300, followed by a bearish continuation back to the main support/imbalance zone...
DXY Weekly Forecast In recent weeks, DXY dropped to the extreme demand zone, sweeping the lows around 98–99, before launching a bullish reversal and breaking through multiple minor highs. Last Friday, price retested a daily Fair Value Gap — perfectly aligned with the NFP release — and held. Now, we may see some sideways consolidation at this level before...
GBP/USD Weekly Forecast – April Week 2 Last week, GBP/USD reached an extreme supply zone near 1.3200, which was also a clean area of imbalance. The pair rejected hard from that level and closed with a strong bearish weekly candle. On the daily chart, we saw a bearish engulfing pattern, confirming downside momentum. Although the daily close didn’t break below...
US500 Weekly Forecast – April Week 2 After Trump’s tariff news and the VIX spiking to 29, the S&P 500 (US500) showed signs of cracking. Last week’s candle broke the prior low at 5,092 and closed at 5,061, forming a clear bearish engulfing candle with strong downside momentum. This confirms a structural breakdown, and the first major monthly demand zone sits at...
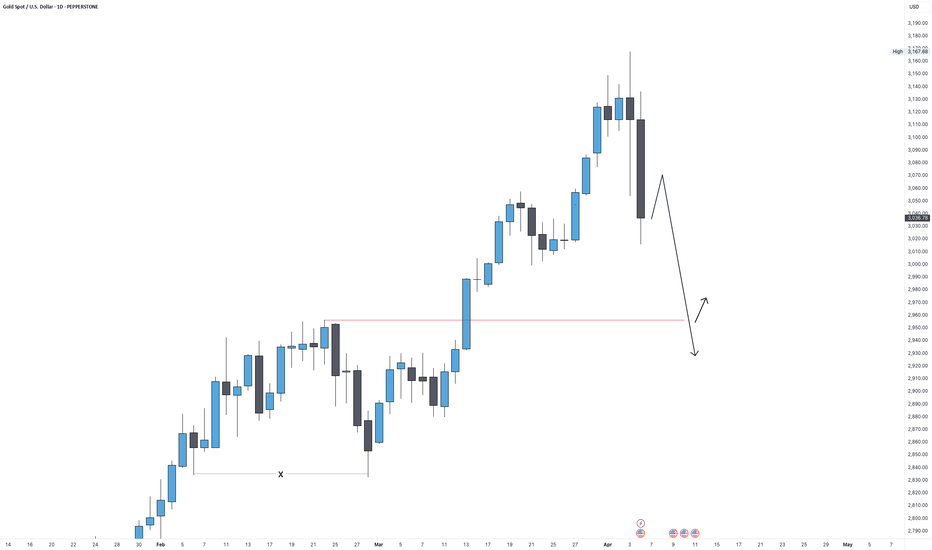
Gold Weekly Forecast – April Week 2 Last week, Gold (XAU/USD) reached a new all-time high at $3,168, before closing the week near $3,035, printing a strong bearish weekly candle. Despite the current risk-off sentiment in global markets — with the VIX spiking to 29 — Gold is not behaving like a safe haven just yet. Instead, the technicals suggest a pullback is...
DXY Technical Outlook – April Week 2 After Trump’s tariff announcement shook the markets last week, the Dollar Index (DXY) dropped sharply into an extreme daily demand zone (102.000–101.500) and responded with strong bullish pressure by Friday’s close. If fear continues into Monday, DXY could extend higher. The key area to watch is 103.500, a solid resistance...
The GBP/USD pair has recently reached a Fair Value Gap (FVG) zone and formed a strong bearish daily candle closure. This price action suggests that sellers are gaining momentum. Our short setup targets the extreme demand zone at 1.2400. A confirmed daily close below the last minor swing low (around 1.26300) will serve as a strong signal to enter short positions...
- Expecting Dollar index to be bullish to the end of the year , - On a short-term basis you can see price retested to the demand zone last week and swept the liquidity from the last minor low at 105.600 and closed above with a strong bullish daily candle. - Next minor high at 106.700 could be a great confirmation for the move so consider closing above that...
- Price has been consolidating within a range for the past week, following the recent bearish move from 2718.0. This range suggests the market is accumulating orders in preparation for the next potential breakout. to be clear I do not know or predict the next big move, but what is clear that before expecting a bullish move we should see at first a small bearish...
Last week, price accumulated significant liquidity below the 2470 level before reversing to the upside. After sweeping minor liquidity at 2523, a key supply zone has emerged at 2504. Notably, the equilibrium aligns with this supply zone, presenting a potentially strong area for a short position. If a valid short confirmation forms at the 2504 level, we could...
Price swept the key liquidity level at 100.600, also capturing the last minor structural liquidity through a manipulation move. Following this manipulation, the price began to rise with significant volume, leaving imbalances in its wake. We can anticipate a retest towards the equilibrium level, potentially sweeping the last minor low as indicated on the charts,...
Price swept the last high at a daily order block and started going bearish, So now we can predict the price to go bearish. - You can observe that price created a minor demand zone at 1.1000 that will be our first target as price may reverse from that zone, second target will be major demand at 1.09400.
- As you see on the charts price swept the liquidity from the last week/day low and closed with 4h strong bullish candlestick, So now we can predict the price to reach 0.88200.


