Stoic-Trader
Premium▶️ DYDX remains stuck inside the black descending channel, and the recent breakout attempt was just a fakeout. ▶️ On the 4H chart, there are no clear signs of a reversal, so the recent upside move appears to be corrective. ▶️ The yellow zone, marked by a confluence of Fibonacci levels and mid-range resistance, is a key area to monitor for potential downside...
▶️ The downtrend is currently held by green support just above 24.00, but there are no signs that the decline is over. ▶️ The move from blue resistance to green support showed strong momentum, suggesting it may be blue wave A of a downside ABC pattern. ▶️ This structure implies that a corrective blue wave B may follow, eventually leading to a blue wave C to the...
▶️ AUDUSD has broken the green ascending channel that had been in progress since late April. ▶️ This break suggests wave 1/A likely concluded at 0.66250, supported by bearish RSI divergence on the high. ▶️ Retests of the bottom of the broken channel could offer short trade opportunities. ▶️ The initial high-probability target is the 38.2% Fibonacci retracement at...
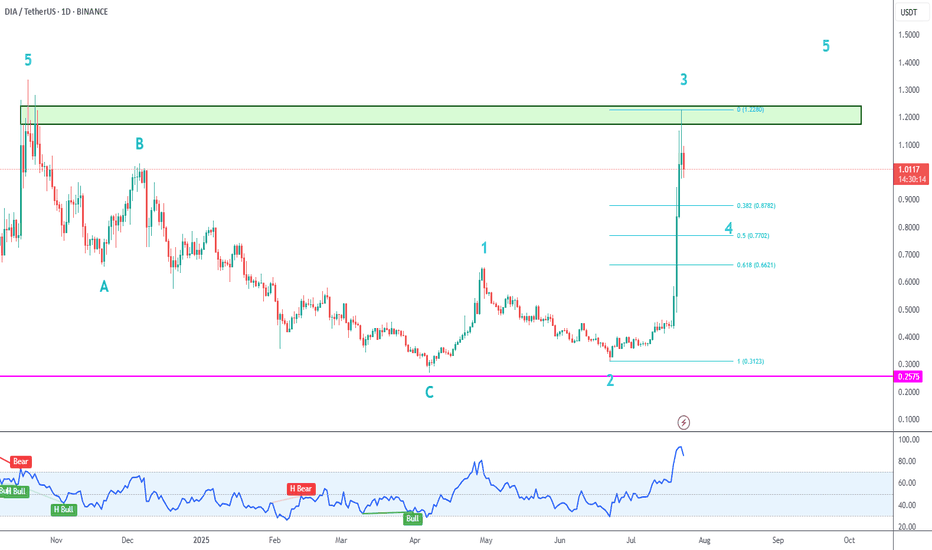
After breaking the black descending channel price made waves 1/2 and pumped to the upside for wave 3, where it was held by the blue resistance zone. We are now in wave 4 correction, and I am waiting for reversals in smaller timeframes for long trades.
➡️ Downside motive wave: We are finishing 5 waves at strong blue support zone. I don´t see enough momentum to break this zone at the moment. ➡️ Expect a recovery: Price will probably make a short-term recovery, with a high probability of reaching the middle of the range at 1.85-1.86. ➡️ After this recovery (wave 2 or B), expect further downside, potentially...
➡️ We had a pretty aggressive move to the downside, which was held by the bottom of the ascending channel. ➡️ Since price is still inside the channel, I have only switched my short-term bias to neutral, not bearish ➡️ Key for bulls: Breaking the green resistance zone around 0.022 ➡️ Key for bears: Breaking the descending channel bottom and blue support zone...
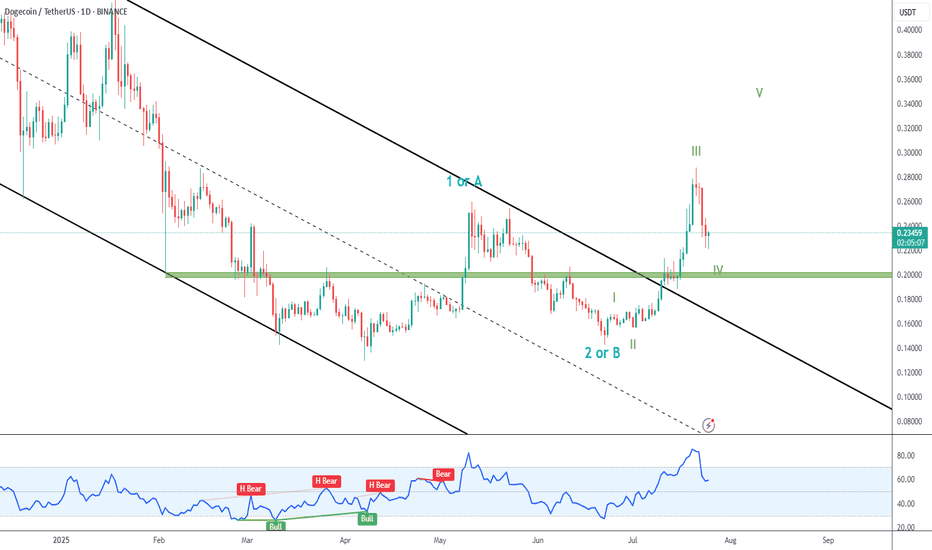
➡️ Dogecoin blasted away from the black descending channel and past green resistance (now support). ➡️ In my primary count, we are currently in green IV correction, and expect new higher highs. ➡️ A retest of green support would be nice, but it is probable that price won´t go that far.
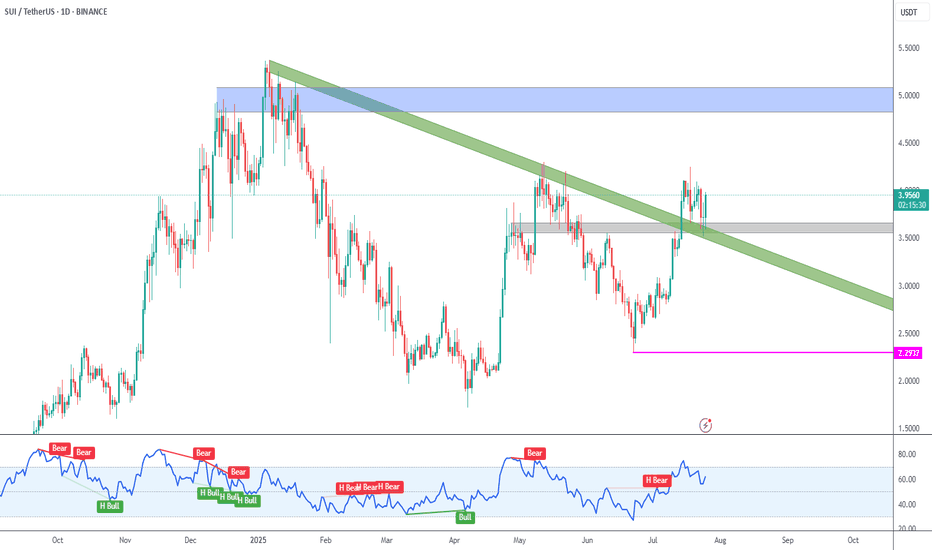
➡️ SUI has broken the green descending trendline originated on the early 2025 high. ➡️ Price is also being held by the gray support zone around 3.60. ➡️ Next target is the blue supply zone at 5.00 round number. ➡️ Invalidation is at 2.2937 (pink line), so be wary of liquidity hunts below gray support.
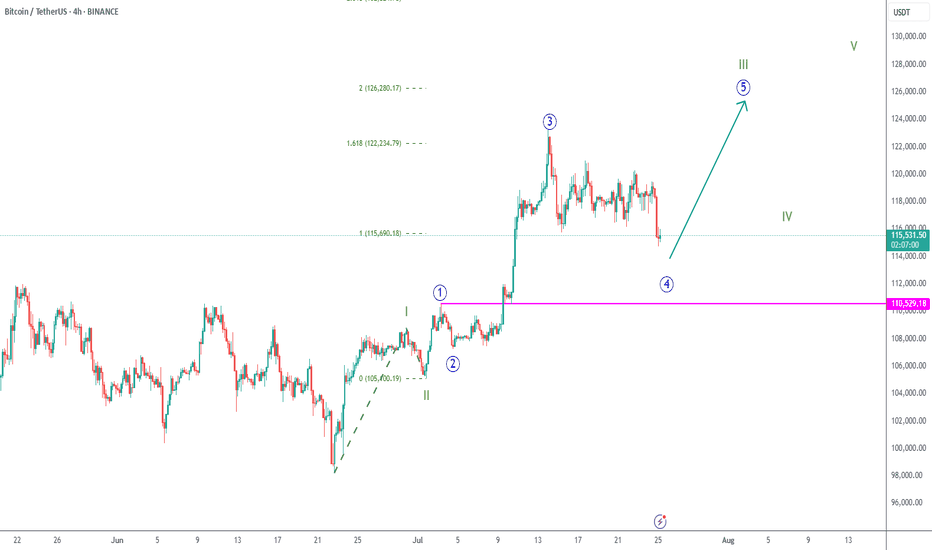
➡️ My wave count considers we're now in blue wave 4, and this corrections should finish soon. ➡️ The 125k round number is an interesting target for green wave III. ➡️ This scenario is valid as long as we stay above blue 1 top (at 110.529).
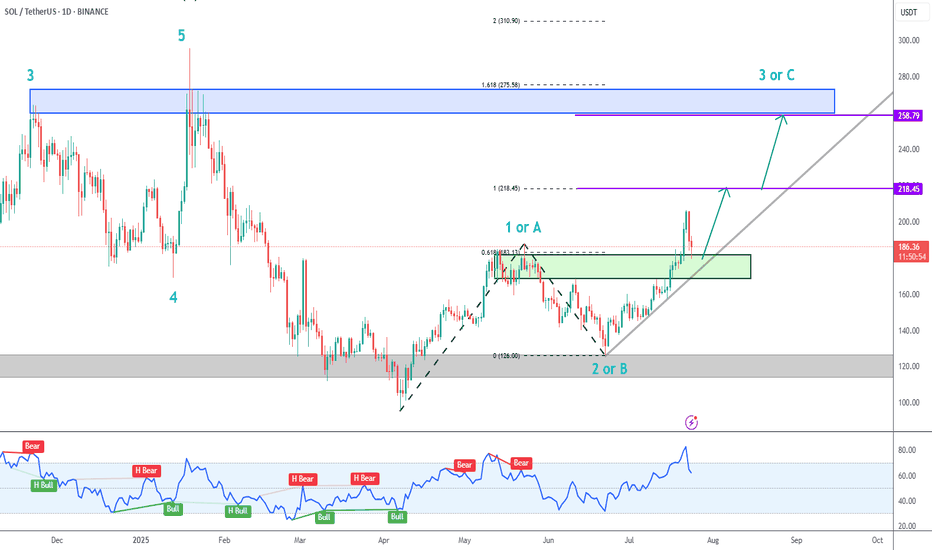
➡️ Solana has been correcting for the last couple of days, but the trend is clearly up. ➡️ There are 2 confluence factors that should give price support: the gray ascending trendline and the green zone. ➡️ Initial Targets (purple lines) are: 218.45 (100% extension) 258.79 (beginning of blue potential supply zone)
➡️ After confirming blue wave C, price is making a motive wave with sub-waves 1 and 2 complete. ➡️ Price is initially being held by the gray supply zone, which dates from October 2024. ➡️ This high could have marked the end of wave 3. Pullbacks are buying opportunities, but I prefer to see at least a 38.2% pullback for wave 4 before looking for new long trades.
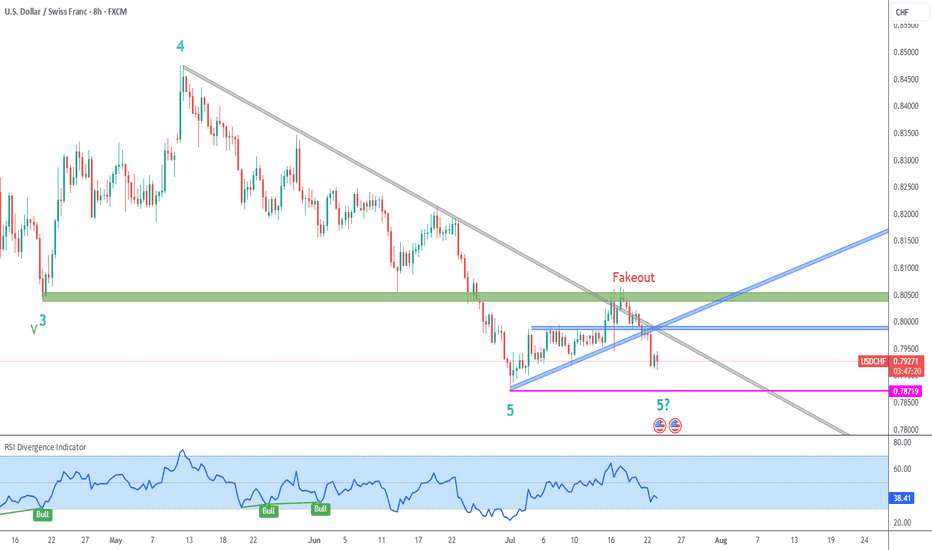
➡️ Price attempted a breakout from longer term gray descending trendline, but was held by strong green resistance, so it became a fakeout. ➡️ Price also broke down from minor blue resistance and ascending trendlines. ➡️ I had labeled the early July low as blue wave 5, but that is up for discussion, due to the lack of bullish follow-up and RSI divergence. We...
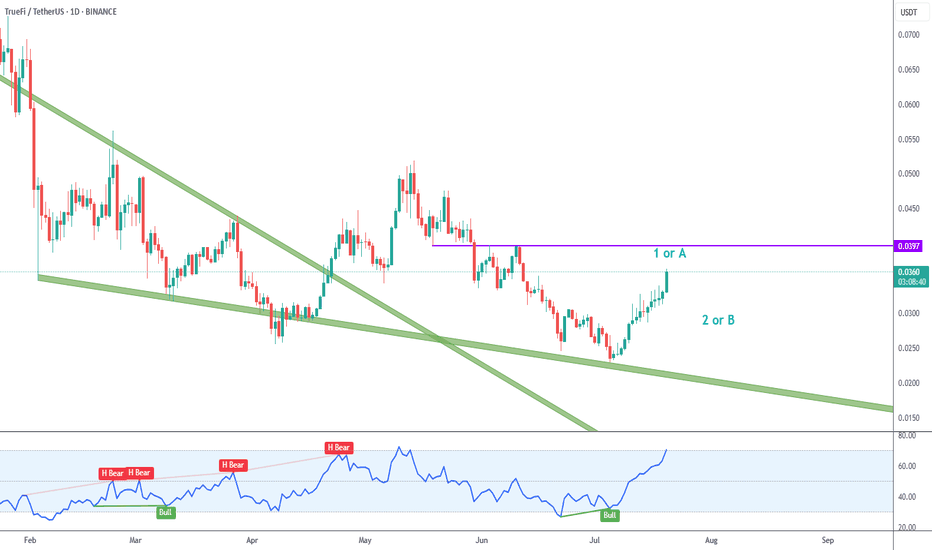
Truefi´s recent upside after touching the green descending trendline looks convincing, with a motive wave and bullish RSI divergence. I´m labeling this as wave 1/A. Right now price is overbought, so I´ll wait for wave 2/B pullback to look for long trades. Next key resistance zone is just below 0.04.
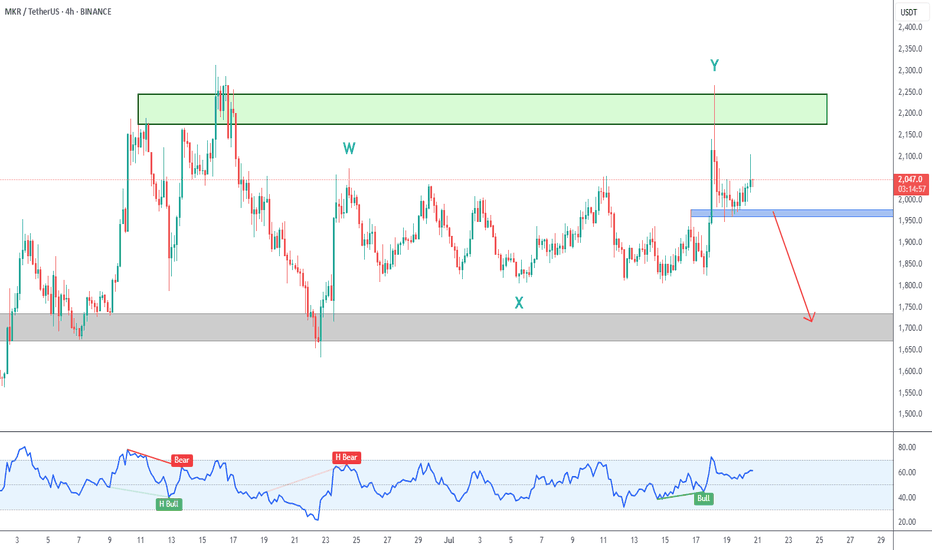
On the 4H Chart the 2,200 supply zone proved to be too strong for bulls, and there was a strong rejection. My primary count considers that was wave Y, and I´m currently neutral to bearish. A break of blue support zone around 1,970 should take us to another retest of 1,700 support.
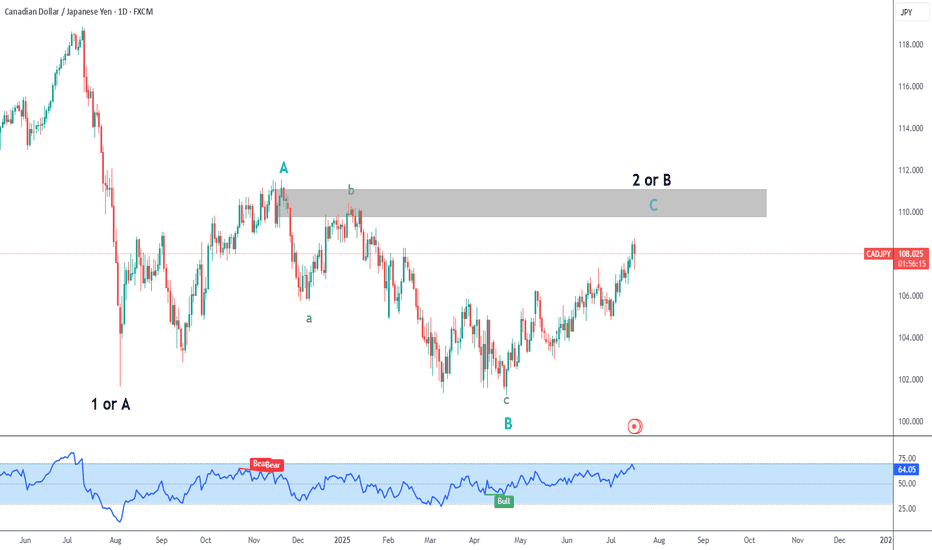
In the bigger picture, the pair is currently inside black wave 2 or B, which is happening as a flat correction (blue ABC). We should still have some upside in the short term. The gray area is an interesting zone to begin looking for short trades.
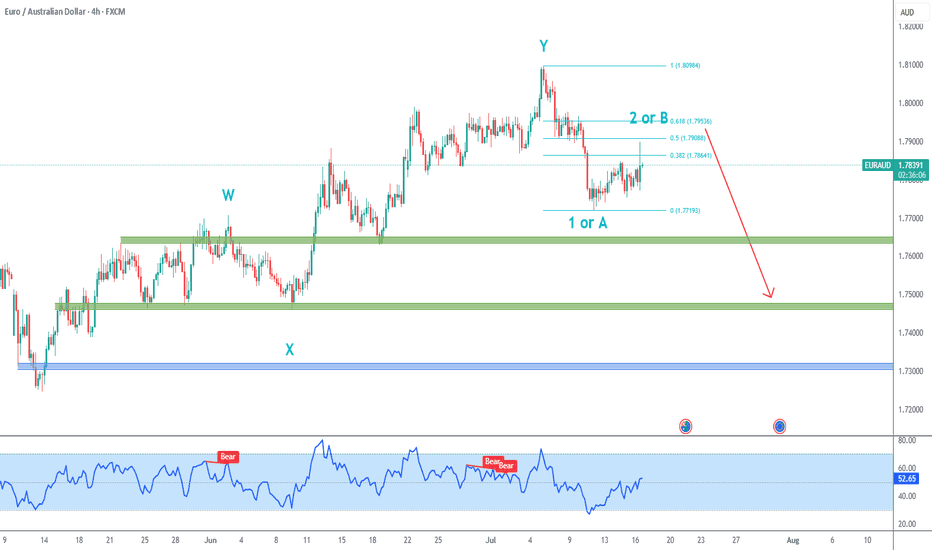
I expect further downside for EURAUD. Ideally, I´d prefer the current upside correction to reach 50% pullback (at 1.79088). Intermediate targets are the green zones which served as resistance & support levels during the uptrend, and final target is the blue zone close to the May pivot low.
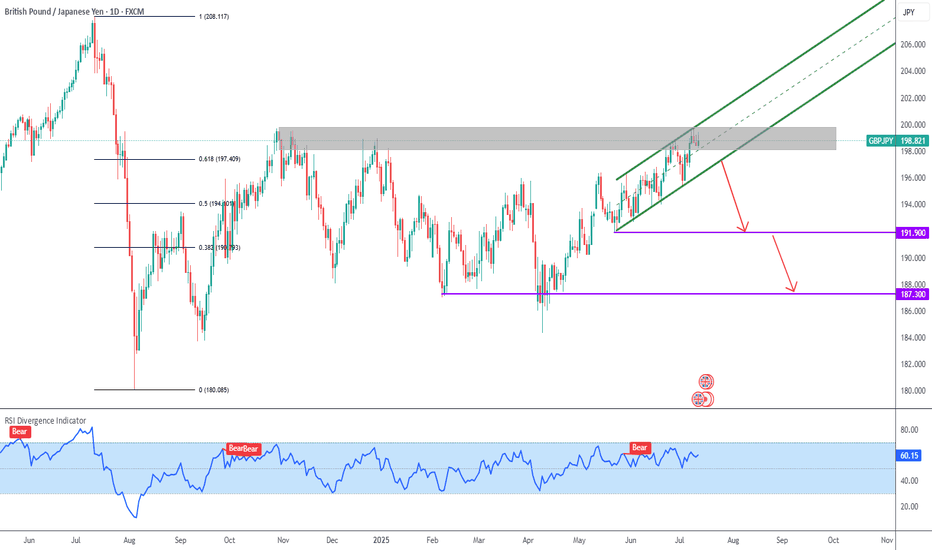
The grind to the upside is losing strength, and I´m waiting for a break of the green ascending channel to the downside. Initial targets are the base of the ascending channel (at 191.900) and close to the recent pivot low (at 187.300)
Bullish price action from the last couple of months has been unconvincing, and this looks more like a wave B correction. A break of the black ascending channel would be a trigger for wave C. It would be interesting to see a reversal pattern in smaller timeframes if price touches the gray supply zone.


