Supergalactic
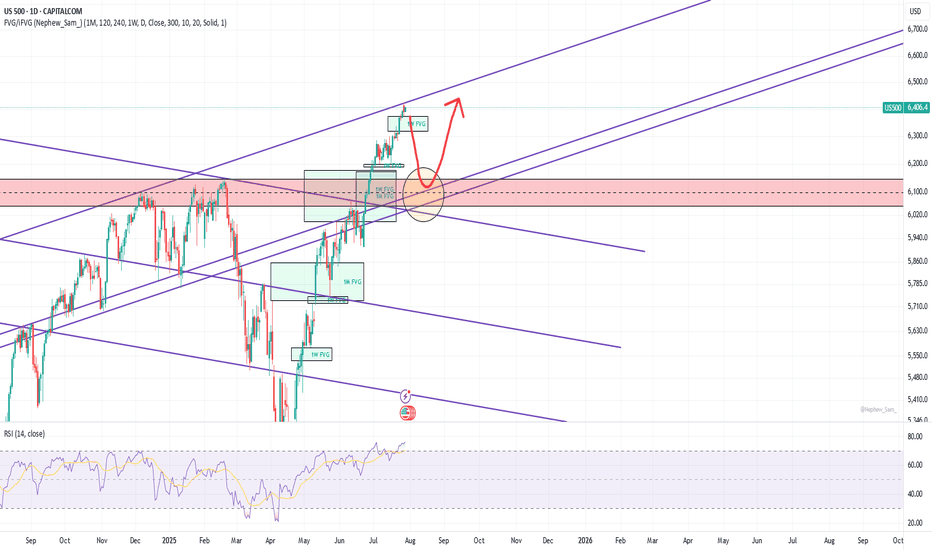
The price is at the bottom of the old broken channel right now that serves as a resistance. Solid 1d divergence on RSI. 6180 is the minimum target - 1W and 1M FVG start there. Retest of the February ATH at 6150 is probable. A spike to 6100 and below is also possible.
The upper trendline starts from Jan 2022 peak. It was broken on normal scale but still holds on log scale. The price may top here or may go higher. In a very bullish scenario the price may bounce much higher from an upper 1W FVG, but I think it will be broken soon. In any case I see a strong support at 6050-6150 area - a horizontal support and 1M/1W FVG are there....
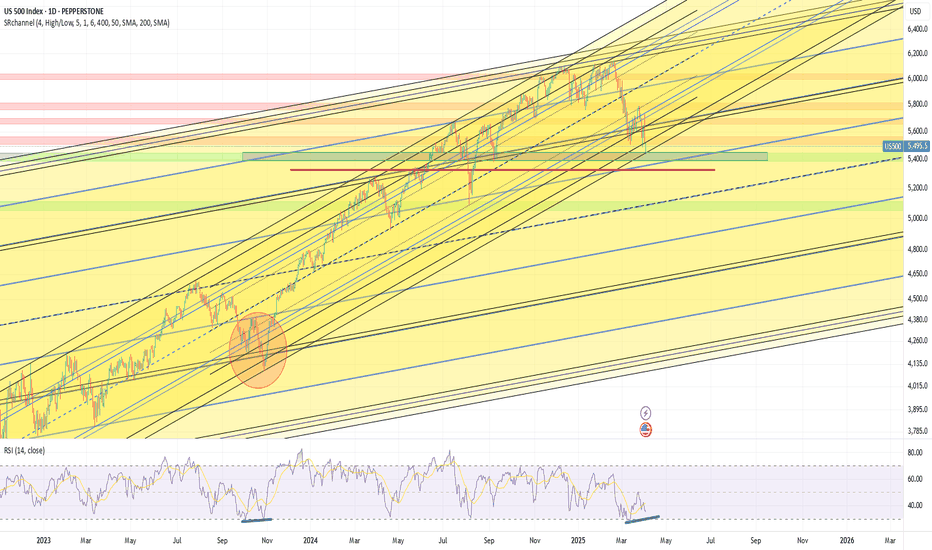
The price has reached a support area at the bottom of the long-term logarithmic channel. If this area will not hold the price I see a possible spike to 5330 level which is 1.618 retracement of March 13 bottom - March 25 top. The price did the same retracement in October 2023. Pay attention that we have 1d positive divergence forming on RSI. We are bottoming, a...
DJI hits this trendline / channel bottom again. I expect a rejection and a correction from it. It's not a classic channel, so a false break-in is allowed.
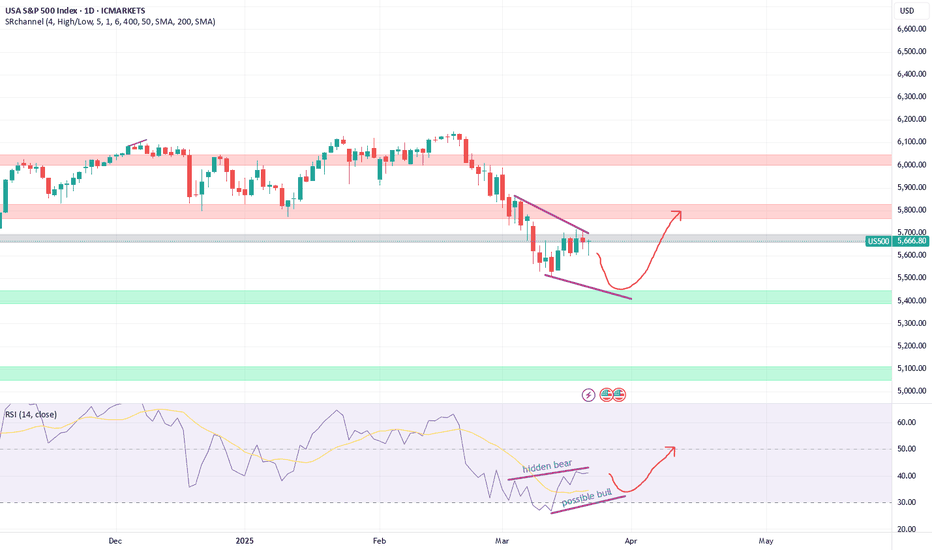
Right now the price is under pressure of a strong 1d hidden bearish divergence. I believe that breaking 5700 level is only possible after making a 1d regular bullish divergence. I.e. the price should make a fake 5500 level break.
I think DJI will retest the broken channel at 0.5 fib retracement and will be rejected from it. There is also 4h hidden bearish divergence (1d on US30). I expect SPX and NDX to fall simultaneously with DJI.
I bet this newly-formed channel will be broken into the FOMC and then the price will crash into the end of the week to test the yellow channel. No reversal signals right now. But who knows, maybe tomorrows housing/building data will disappoint the market.
Huge buyings took place today, but on bigger timeframes it looks like just a retest of the rising wedge. There are also hidden bear divergences on 1-4 tf on US500, US100 and US30. I guess we will see continuation of the correction to 5730-5650 area next week. The idea will be invalidated if the price returns into the rising wedge (crosses the purple trendline).
Dow Jones has made 0.786 retracement and reached the bottom of the channel. There is a positive 4h divergence on RSI. I think we will at least see a bounce from here tomorrow.
Hidden positive divergence on 1d and 1w + bottom of the channel. Should make a big bounce soon. Valid as long as the price doesn't update January 13-14 low.
Thinking of possible scenarios. You can ignore the arrows, just pay attention to the orange channel. It is not confirmed as long as there is only one bottom hit, but its bottom may serve as a support at some point. I'm not calling for a crash, but 10% correction in the near future seems probable to me.
The price broke out of the ascending channel. I think it will continue it's downward movement after the channel bottom retest.
The price has reached the center of the wide ascending channel and a trendline that served as a bottom of an old channel that was broken during December dump - now it's a resistance. I also see 2h divergences on 2h RSI on US30, but not on DJI yet. I think it will grind the resistance for some time, create more divergence and go for a pullback.
I think the correction has started. The likely target is 5930-5907.
Bearish divergence on 15m, 1h. Gonna short it atleast to 5907 - volumes are there. Maybe will go lower to 5880, most likely will only add longs there.
I have noticed a hidden bearish divergence on 4h tf - like in August. Should go down soon, but still can go a little bit higher, there are volumes at 6055 (oanda).
Looks like S&P is heading towards the top of a big channel that began from October 2023 low. This is an attempt to predict when and where it would happen, which is approximately on November 18 at 6115.
1. Hanging man candle on 1D tf 2. Bearish divergence on 1H and 4H tf 3. The price has broken out of the ascending channel and retested it from below So it's gonna fall. My targets are on the chart.


