Tdawly_Official
EssentialTimeframe: Hourly (H1) – *Data as of Aug 01, 2025, 14:33 UTC+4* Source: OANDA via TradingView 1. Key Price Levels Current Price (C): 1.07357 (+0.09% from previous close). High/Low (H/L): 1.07386 / 1.07308 (narrow range, indicating consolidation). Resistance Levels: R1: 1.07514 (near-term resistance). R2: 1.08208 (stronger resistance). Pivot Point (P):...
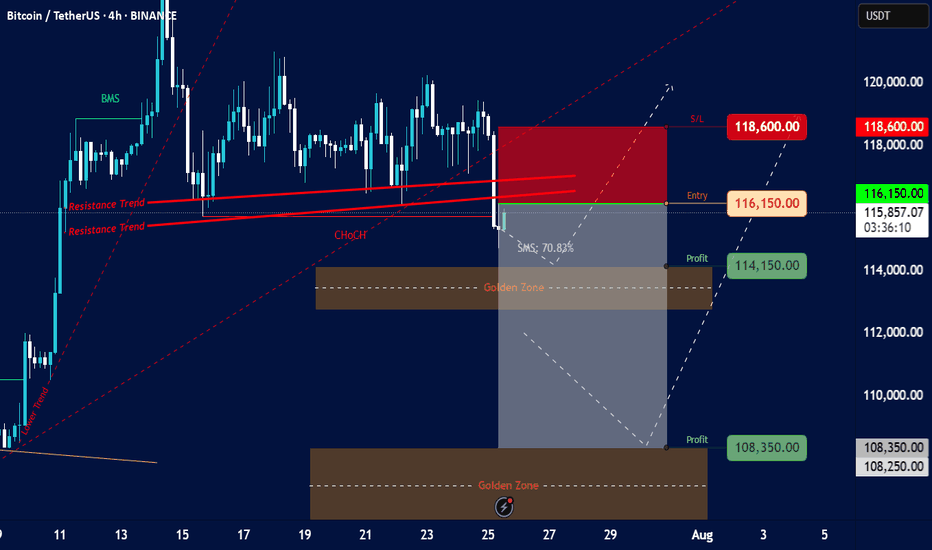
Bitcoin/TetherUS (BTC/USDT) Trading Analysis - Jul 15, 2025 Key Observations: Price Movement: Current Price: $117,692.46 24h Change: -2,148.72 (-1.79%) Range: Low of $116,250.00 to High of $119,940.83 The price is currently near the lower end of the day's range, indicating bearish pressure. Support and Resistance: Support Levels: Strong Support:...
Key Levels Support Levels: Immediate: 3,294.000 (S/L level) Next: 3,280.000 Resistance Levels: Immediate: 3,304.000 (Entry level) Next: 3,308.000, 3,316.250, 3,320.000 Profit Targets: Tiered levels up to 3,328.000 (highest target). Price Action & Trends Current Trend: The price is bullish (+0.84% today) but hovering near the entry level (3,299.000) and...
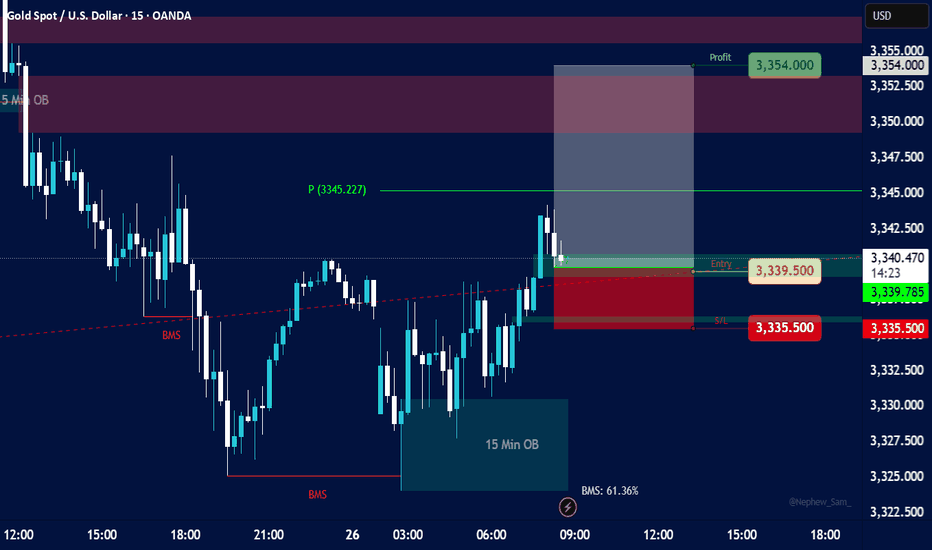
Key Elements and Observations: Price Action: The price initially shows a downtrend, breaking below a previous low, indicated by "BMS" (likely "Break in Market Structure" or "Break of Market Structure"). Following the break, the price consolidates and then shows a strong upward movement, breaking above a resistance level, again marked by "BMS." This suggests a...
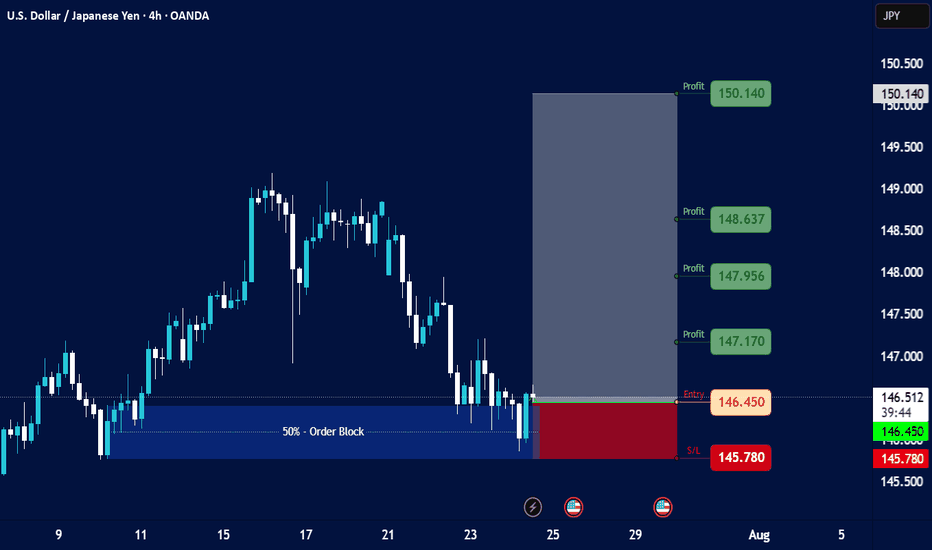
Key Observations: Price Action (4h Close): Open (O): 146.545 High (H): 146.660 Low (L): 146.448 Close (C): 146.473 Change: -0.036 (-0.028%) → Slight bearish momentum. 50% - Order Block: Indicates a key retracement level where institutional traders may have placed orders. Current price near 146.473 suggests potential consolidation or reversal if this level...
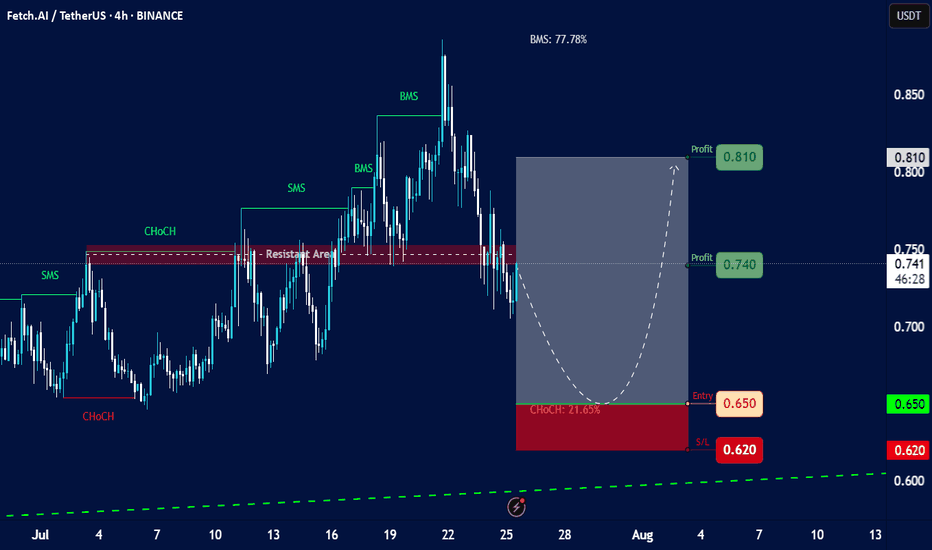
Overall Trend and Market Structure: The chart displays a mix of bullish and bearish movements, but recent price action (from around July 23rd onwards) shows a significant downturn after a peak. There are "SMS" (Structural Market Shift) and "ChoCH" (Change of Character) labels, indicating shifts in market structure. Initially, there were bullish shifts, but the...
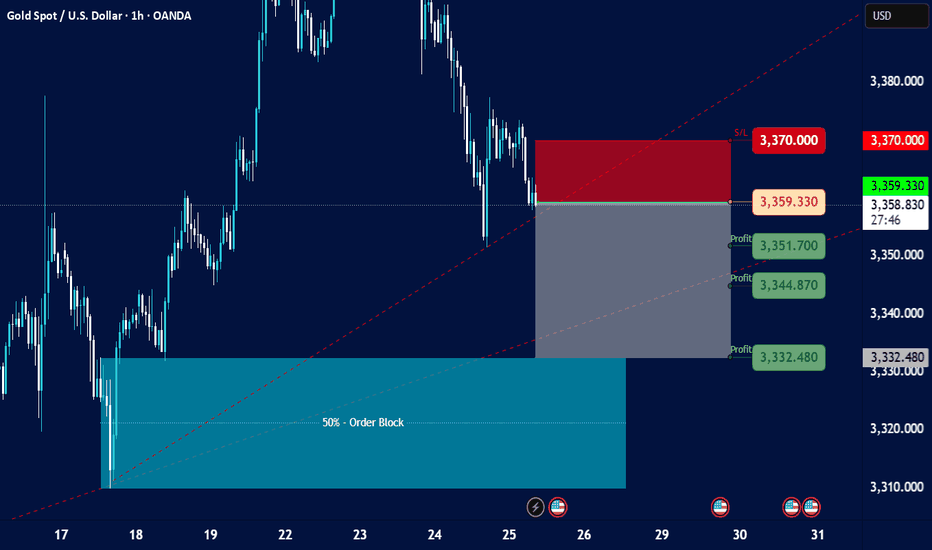
Current Price and Trend: The current price is shown as 3,359.330, and the last traded price is 3,359.005. The chart indicates a downtrend in recent sessions, with the price having fallen significantly from higher levels around 3,380.000 to 3,390.000 down to the current levels. There's a dashed red line (possibly a trendline or resistance) indicating a downward...
Chart Overview: Asset: Fetch.AI (FET) against TetherUS (USDT). Timeframe: 4-hour (4h) candles. Current Price (approximate based on chart): Around 0.741 USDT. Date and Time on Chart: July 25, 2025, 15:11 UTC+4 (This matches the current provided time context, so the chart is very recent). Overall Trend: The chart shows a recent upward movement followed by a...
Overall Trend & Price Action: Prior Uptrend: The chart shows a clear uptrend leading up to around July 15th, marked by an "Order Trend" line (dashed green). Break of Market Structure (BMS): A "BMS" (Break of Market Structure) label is visible, suggesting a significant shift in market dynamics, likely indicating the end of the previous uptrend or a strong...
⸻ 1. Trade Setup Summary ✅ Trade Type: Long (Buy) ✅ Entry: 3,322.250 ✅ Stop Loss (SL): 3,311.500 ✅ Take Profits (TP): • TP1: 3,341.000 • TP2: 3,358.000 • TP3: 3,378.000 ⸻ 2. Chart Context Analysis 🔷 Structure: • The market had a strong bullish push before a correction phase. • Current candle is aggressively bullish from the zone near your entry,...
Price Overview Current Price: 3,286,190 24h Change: +15,525 (+0.47%) Recent High/Low: High: 18,286,420 Low: 12,284,465 Order Block (OB) Analysis Profit Targets: Multiple profit levels are identified, with the highest at 3,339,000 and the lowest at 3,279,000. The price is currently between the 3,286,190 (current) and 3,279,000 (next profit level), suggesting...
Here's an analysis based on the information presented in the image: Overall Market Structure (from a quick glance): Recent Price Action: The price has recently experienced a significant decline, followed by a bounce. Order Block (OB): There's a clearly marked "4 Hours OB" (Order Block) which is a key area of interest for potential resistance. Potential Trading...
Current Price Action: The USD/JPY pair is trading at 144.414, down -0.842 (-0.588%). The price is hovering near the 20-period BMA (144.384) and OXIDA level (141.784), suggesting a potential inflection point. Support and Resistance Levels: Immediate Resistance: 144.500, 145.000, 145.500. Strong Resistance: 146.000, 146.530, 147.000 (profit target). Immediate...
Key Data Points: Current Price: 3,309.065 USD Open: 3,358.435 USD High: 3,363.900 USD Low: 3,307.295 USD Change: +1.77% (+59,760 points) Volume: Not explicitly stated but implied by "1B" (likely 1 billion units). Price Action & Technical Observations: Trend: The price is currently below the open (3,309.065 vs. 3,358.435), suggesting a pullback after an...
### Bitcoin Price Analysis (June 21, 2025) #### **Current Price**: $103,236.15 (as of the snapshot) - The price is hovering near the lower end of the recent range, with key support at **$102,000** (marked as "S/s" on the chart). - Resistance levels are visible at **$105,000**, **$107,000**, and **$110,000–$114,000**. #### **Key Observations**: 1....
Entry Level: 3,416.000 USD Price is currently at 3,425.640 USD, so the entry was already triggered and the position is active and in profit. Stop-Loss (SL): 3,407.500 USD Positioned below the minor FVG area; protects against deeper downside if structure fails. Take-Profit Targets (TP): TP1: 3,423.000 USD (short-term scalp zone — already reached) TP2:...
✅ Trade Plan (Long Setup): Entry 166.800 Stop Loss (SL) 166.600 Take Profit 1 (TP1) 167.200 Take Profit 2 (TP2) 167.430 shift stop to entry after TP1
Entry Point: Entry Level: 106,300 USDT Price is currently slightly below entry (106,254.67), so the trade setup is still valid and could trigger soon. Stop-Loss (SL): Stop Level: 104,250 USDT Defined just below the lower FVG zone, indicating where invalidation would occur. Take-Profit Targets (TP): TP1: 109,000 USDT (near minor resistance) TP2:...


