The_Trading_G3ek
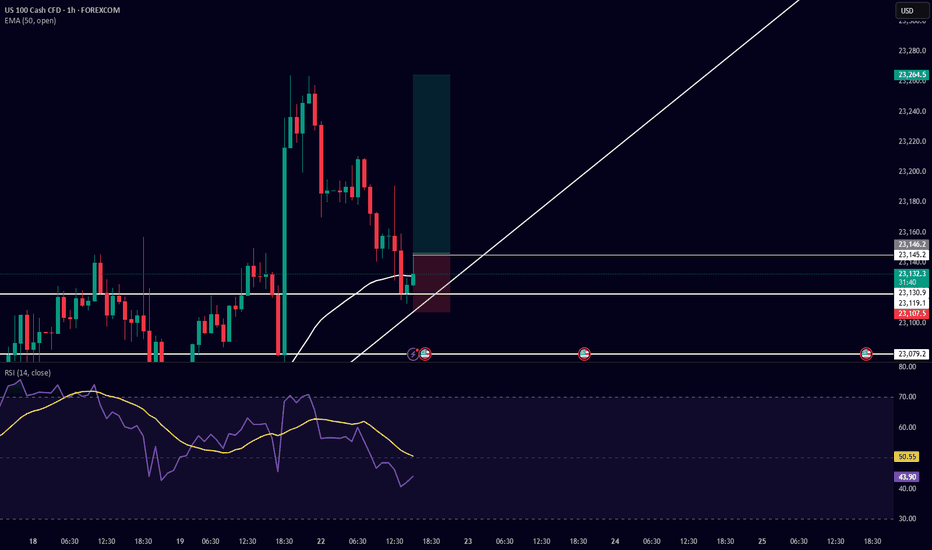
I am taking a buy-side trade on US100 based on the following confluences: Support & Trendline Respect: Price respected a horizontal support level near 23,079.2 and is currently bouncing from a rising trendline, showing potential for a bullish move. Bullish Candlestick Reaction: After testing the trendline, bullish candles formed, indicating buying interest at...
Timeframe: 4H Entry Price: ~0.85168 Trade Type: Buy (Long Position) Technical Justification: Bullish Reversal Setup: After an extended downtrend, price action has formed a potential reversal pattern with higher lows, indicating early signs of bullish momentum. Break of Consolidation Zone: Price has broken above recent consolidation, suggesting a possible trend...
HEre is the potential long oppurtunity in GBPNZD, WE can Put the Long Entry Here....
Analysis Summary: The EUR/GBP pair has shown a potential bullish reversal on the 4-hour timeframe after forming a double-bottom structure near the 0.84800 support zone. A trendline has been drawn from recent higher lows, suggesting the initiation of an upward move. Technical Indicators: RSI (14): The RSI has broken above a descending trendline, indicating...
📈 Pair: EUR/GBP 🕒 Timeframe: 4-Hour 📥 Entry Price: 0.85112 🎯 Take Profit (TP): 0.86300 (approximate based on visual RR box) 🛑 Stop Loss (SL): 0.84786 🔍 Trade Setup Explanation: Strong Support Zone: The price has bounced multiple times from the 0.84900–0.85000 support area, indicating buyer strength and market rejection of lower prices. 200 EMA Acting as...
📉 Pair: NZD/USD 🕒 Timeframe: 4-Hour 📥 Entry Price: 0.59267 🎯 Take Profit (TP): 0.58265 🛑 Stop Loss (SL): 0.59893 🔍 Trade Setup Explanation: Trendline Rejection: Price has respected a descending trendline, confirming it as dynamic resistance. The recent candle shows rejection from this trendline, signaling a potential move downward. Horizontal Resistance Level:...
I have entered a short position on XTIUSD (WTI Crude Oil) based on a multi-timeframe bearish confluence setup: Weekly and Daily Trend: The overall structure on both the weekly and daily charts is bearish, showing a consistent downtrend and favoring sell setups. Daily Chart Structure: Recently, price formed a lower high on the daily timeframe, indicating...
Trend & Momentum: RSI (14, close) currently shows a range between -7.25 to 35.47, indicating potential oversold conditions (RSI below 30-35 often signals a reversal opportunity). The Average YoY data suggests moderate volatility, with Q2 at 0.558 and H1 at 0.555, hinting at a stable uptrend bias. Price Action: Support Levels: L1 at 0.499 and C1 at 0.498 act as...
📈 Technical Breakdown: Price bouncing off ascending trendline – higher lows in place Sitting near confluence of dynamic support (EMA 50) and structure RSI rebounding from midline (bullish momentum possible) Clean risk-to-reward setup with defined TP levels 🎯 Target Zones (TPs): TP1: 0.86097 TP2: 0.86472 TP3: 0.86864 TP4: 0.87239 TP5: 0.87391 🛡️ Stop...
📊 Technical Highlights: Price respecting bullish market structure (HH – HL) Strong rejection candle from dynamic support (EMA 50) RSI recovery from oversold zone with bullish divergence potential Target zones: 🎯 TP1: 3405 🎯 TP2: 3471 🎯 TP3: 3499 SL placed below recent HL (around 3279) for risk management 🧠 Bias: Bullish 📈 Strategy: Buy the dip / trend continuation
Entered a buy position on NAS100 after price retraced to the 0.618 Fibonacci level, which also aligns perfectly with the ascending trendline support. This area has acted as a strong confluence zone, showing signs of a potential higher low (HL) formation on the 4H chart. ✅ Confluences supporting the trade: Price bounced from the 0.618 Fib retracement. Respecting...
I have taken a buy position on USDJPY based on a confluence of technical factors supporting a bullish bias: 🔹 Key Weekly Support Zone: Price recently bounced from a strong weekly support level, which has held well in the past, indicating buyers' interest. 🔹 Bullish Daily Candle: On the daily timeframe, a strong bullish candlestick closed above the support level,...
ETH/USD has broken its structure on the 4H timeframe and taken support exactly at a key Fibonacci level. From here, a potential long trade setup could be forming. If we enter around these levels, there’s a good chance of making a decent profit.
🔍 Multi-Timeframe Confluence Strategy This trade is a bullish entry on the 15-minute chart of Crude Oil (XTIUSD), based on a confirmed bullish structure shift on the 4H timeframe. The 15M entry aligns perfectly with HTF (higher timeframe) momentum, making this a high-probability setup. ⏰ 4H Timeframe Breakdown: Price has broken previous 4H lower highs, confirming...
This is a weekly timeframe bullish setup on USD/CAD, focusing on a high-probability buy opportunity based on key support structure and RSI dynamics. 🧠 Technical Outlook: Price has strongly rejected a major historical support zone around 1.37781 – 1.38800, highlighted by the green horizontal line. This level has acted as strong support multiple times in the past,...
USD/JPY has perfectly tested my supply zone and shown a clear rejection. Based on this, we can consider opening a short position. Fundamentally, USD/JPY also appears weak, and the Japanese Yen is considered a safe haven. Given the current market conditions, this could be a good trade setup.
audusd making a series of high and also retrace from 1 day trend line we can enter here and make good profit.
GBPUSD rejected from a strong supply zone at 4h level,we can sell here and make good profit.


