VitalDirection
PremiumThe setup has been unfolding beautifully, and the momentum is now shifting. Our analysis suggests a strong bullish breakout is imminent. Wave structure is aligned, support is holding, and the path higher looks open. We’ve been tracking this patiently—now it’s showtime. 📈 Let’s ride the wave.
We’ve been spot on calling for a correction—and Bitcoin followed our roadmap to the letter. ✅ 100% accuracy on the recent declines. Now the tide is turning. The wave structure suggests a major bullish reversal is underway. Momentum is shifting, and it’s time to prepare for the next impulsive leg up. Bitcoin is ready to fly. See you on the other side. 🌕📈
We’ve been calling for a decline—and the market delivered exactly as forecasted. ✅ 100% accuracy on the previous moves. Now the structure is shifting, and signs are pointing to a strong rebound. Wave count, momentum, and price action all align for the next bullish leg. Time to flip the script. See you on the other side. 📈
🧠 What Is the VIX and Why It Matters Right Now The Volatility Index (VIX), often called the “fear gauge,” has surged to nearly $60, a level we at Vital Direction had anticipated weeks in advance. This dramatic move has injected high volatility across global financial markets — particularly the SPX500, Nasdaq, DAX, and key Asian exchanges like China, Singapore, and...
With a strong rebound anticipated in SPX500, we expect UVXY to decline towards the $18.50 area before a major reversal back to $30. Key levels to watch—stay sharp! 📉📈
We anticipate a strong rebound to form an X wave, followed by a deeper correction before reaching a final bottom between 23rd April – 8th May 2025. Key levels and timing align with our broader market analysis—stay prepared! 📉📈
Gold may have completed a five-wave impulse to the upside, indicating a potential peak forming today. If confirmed, we expect a reversal and a corrective decline to follow. Traders should remain cautious and watch for signs of weakness, as this could mark the beginning of a strong downturn.
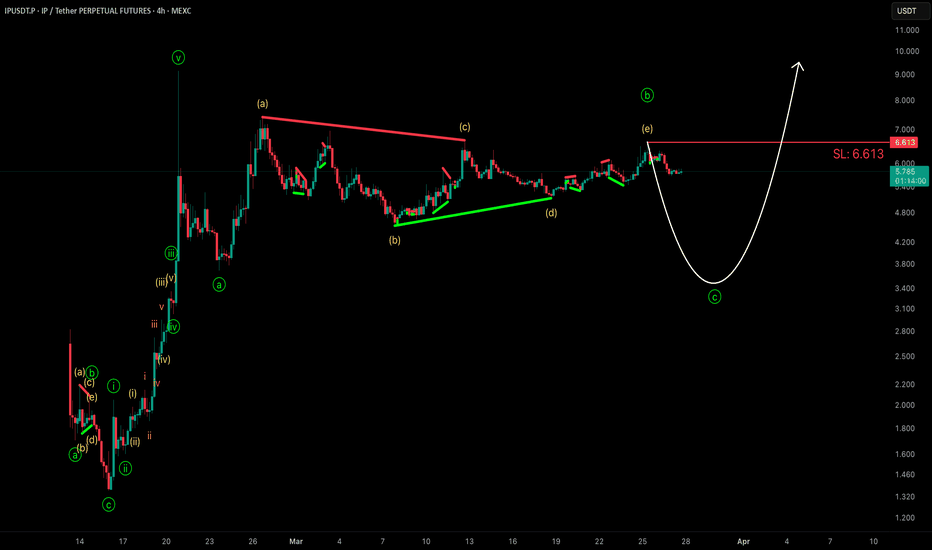
IP is expected to decline to $3.6 after completing a triangle in Wave B, now moving lower to finalise Wave C as part of an ABC pullback. ⚠️ Key Level: Any touch of $6.613 would invalidate this short-term bearish structure. Stay vigilant and monitor price action closely!
XRP could be forming a potential triangle pattern, signalling a major breakout ahead. 📈📉 Keep a close watch on key levels—volatility could be incoming! ⚡
Bitcoin is at a critical juncture. Will we see a push to $100K first, or a rejection around GETTEX:92K before another wave down to the $66K- FWB:73K zone? 📉 The next few moves will be key in determining the bigger trend. Stay prepared for volatility! ⚡
Since the bottom at around $4.518, we believe IP has moved up in a clear 5 waves and then corrected in a clear 3 waves. We see a potential trend reversal, with IP poised to start wave 3 on a larger timeframe, aiming to break the all-time high of $9. This setup offers an excellent risk-to-reward opportunity and is definitely worth considering.
Expecting a rebound for the SP500 from current levels until mid-March (around the 13th). We anticipate a strong sell-off after that, lasting until late March or early April, potentially bottoming between $5,100 and $5,400. Afterward, a massive bottom followed by a strong upward move for both the S&P 500 and the broader U.S. stock market, including crypto.
Understanding the VIX Index: A Comprehensive Analysis for Market Predictions The VIX index, often referred to as the “fear gauge” of the financial markets, provides crucial insights into market volatility. Since its inception, the VIX has been a valuable tool for investors and analysts seeking to gauge market sentiment and potential turning points. Historical...
At Vital Direction, our Elliott Wave, Fibonacci, and Gann analysis suggests that the S&P 500, Nasdaq, Russell 2000, and broader U.S. markets are approaching a major topping formation, setting the stage for a sharp 10-15% correction. We anticipate this downturn to unfold between now and mid-April, with potential bottoming phases emerging either in early March or...
From a technical perspective, we believe gold is currently in the process of completing Wave 4. The rally to $2,850 marked the end of Wave B, a pivotal moment before a corrective pullback. Our analysis suggests that this pullback, classified as Wave C of Wave 4, is expected to drive gold prices down to approximately $2,400 per ounce. This corrective phase is...
Our Elliott Wave analysis suggests that Tesla is gearing up for a strong rally to the $428 region by the first week of February. However, we anticipate a sharp correction thereafter, with the price dipping towards $310 by the last week of February before launching into a massive bullish wave, ultimately breaking the $500 resistance! This movement aligns with our...
NIO (NYSE: NIO) is poised for a massive surge as it completes an ABC correction, with the C-wave forming an ending diagonal. From the current price of $4.43, we anticipate a strong breakout, pushing the stock past the $7.50 resistance and igniting further bullish momentum. ⚡ Key Levels to Watch: 🔹 Bullish Target: $7.50+ 🔹 Invalidation Level: Any drop below...
SPX500 has formed a bullish triangle, signalling an imminent move higher. Our Elliott Wave analysis suggests a rally from the current price of 6,050 to a double top around 6,130. However, a break below 6,029 would invalidate this bullish scenario. After reaching the 6,130 level, we anticipate a sharp downturn to new lows.


