Wicks_Hunter
XAUUSD Long Setup – Order Block Buy Opportunity Price is respecting the 3375–3380 order block zone, showing strong bullish potential. I’m looking for buy entries in this zone with the main target at 3438. A break and hold above 3438 will confirm strong bullish momentum and could open the door for further upside. Plan: Buy Zone: 3375–3380 Target (TP):...
XAUUSD H1 — Order Block Buy Setup 📈" BOS confirmed .Price retracing to order block (3350–3353). Looking for bullish reaction to target 3390–3400. Risk small, aim big. #XAUUSD #GoldAnalysis #OrderBlock #BOS #PriceAction #SmartMoney #TradingSetup #Forex #Gold #SwingTrade #TechnicalAnalysis #RiskReward #TradingPlane
Gold is currently trading near 3323 after a recent sharp drop from the 3431 high. The price is respecting the downtrend line and has tested the 0.236 Fibonacci retracement at 3281 as support. 📉 Bearish Outlook: If the price fails to break above 3314–3325, we could see a continuation toward the 3282 and possibly 3281 support zone. 📈 Bullish Scenario: A break and...
Market Outlook: Gold is approaching a critical zone that could decide the next major move. Based on the current price action and structure, we’re watching for either a bullish rebound or a bearish continuation. --- Key Levels to Watch: Resistance Zone (Sell Area): 3,440.00 Decision Zone: ~3,308.69 (Key support/testing point) Support Zone (Buy Area):...
Key Levels to Watch This Week Resistance: 3,378 $ → 3,400 $ → 3,500 $ (ATH). Support: 3,300 $ (psychological & weekly low cluster) → 3,270 $ (50‑day SMA) → 3,200 $. Key Levels to Watch This Week Resistance: 3,378 $ → 3,400 $ → 3,500 $ (ATH). Support: 3,300 $ (psychological & weekly low cluster) → 3,270 $ (50‑day SMA) → 3,200 $. Trading tactics (not...
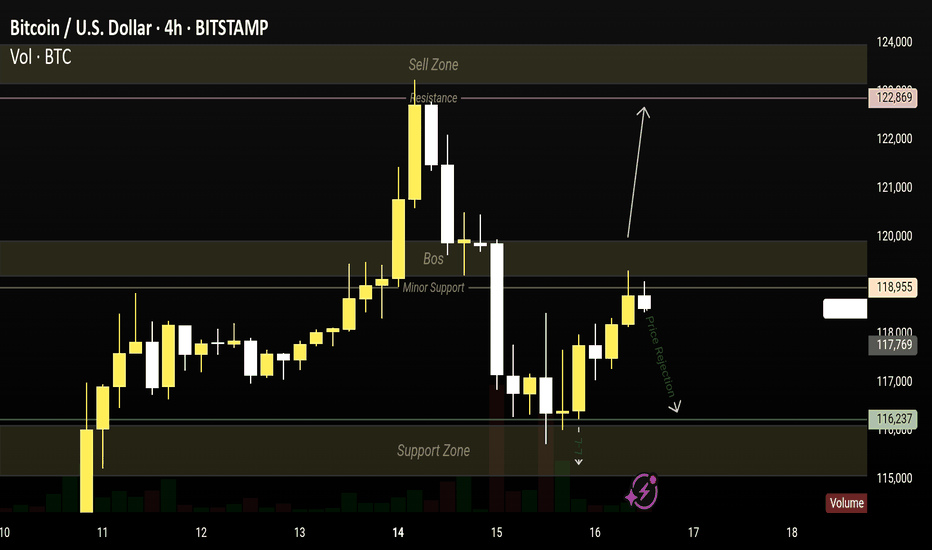
KOG BTC 4H CHART 🔹 Sell Zone: 122,869 🔸 Resistance Holding Strong! 🔻 Price Rejected from 118,955 Minor Support • Watch for pullback toward 116,237 Support Zone • Possible BOS retest before next move • If breaks → watch for continuation to 115,000 • If holds → bullish bounce possible • Volume spike confirms reaction level.
Sell Zone (Upper Yellow Box ~3352.00) A major resistance area from which price previously rejected strongly. Expecting seller activity if price revisits this zone. Suitable for scalp sells or swing shorts if price fails to break above cleanly. Level to Monitor (Mid Green Zone 3324.00–3326.00): Key demand area / structure support. If price pulls back here...
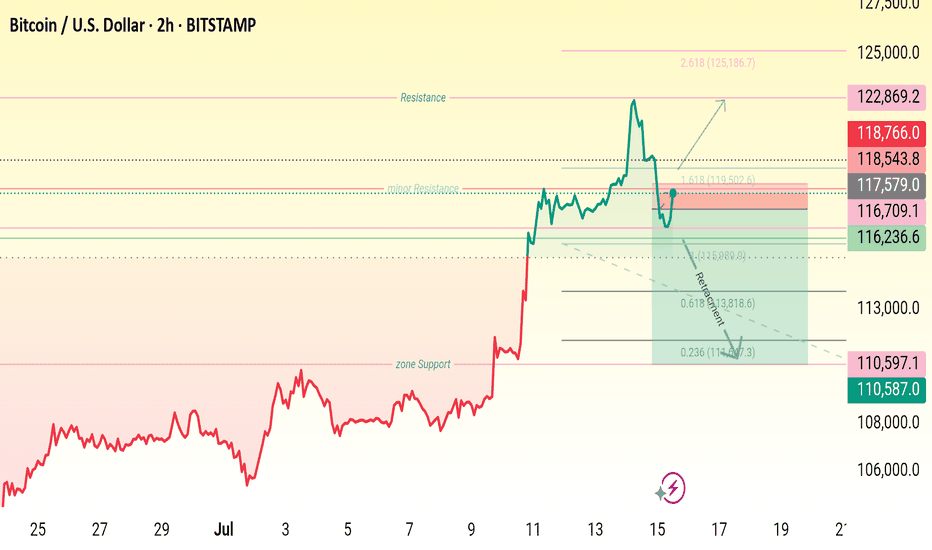
Wait for price rejection . •Entry Zone: 115,900 – 116,700 • Stop Loss: Below 110,587 🎯 Target 1: 118,543 🎯 Target 2: 122,869 • Extension Target: 125,186 (1.618 Fib)
Drawn from the major swing low ($3,500): 0.236 Level = $3,418 → minor resistance 0.618 Level = $3,274 → critical retracement (gold bounced near this) 1.000 Level = $3,131 → absolute support These levels suggest the retracement may be over, and price could be prepping for a new push.
Gold is currently ranging within a horizontal consolidation zone. The price is oscillating between the support at ~$3,172–$3,344 and resistance at ~$3,415–$3,500. A pullback zone is identified near $3,344–$3,346, aligning with prior minor structure and the Fibonacci 0.618 level. These levels suggest the retracement may be over, and price could be prepping for...
High: $119,444 – New swing high reached, showing +25.71% gain from the recent low. Bullish Continuation/If the support holds, buyers are expected to step in and push price further above the recent high toward the next resistance range of $124K+.
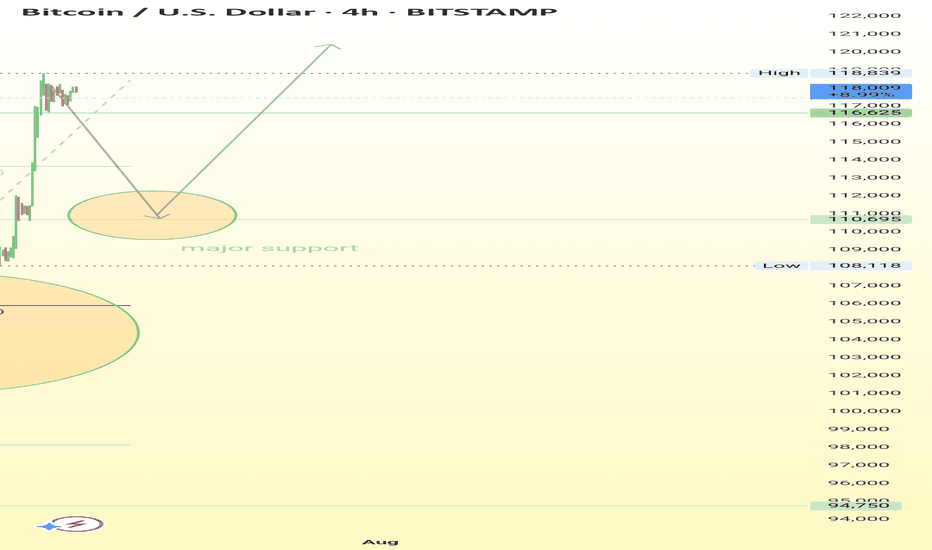
BTC recently surged, reaching a local high at ~$118,839, showing a sharp upward movement. Price is currently consolidating just below the recent high. A horizontal support is marked at $110,695, aligning closely with the 0.236 level. A larger support zone is marked around $105,902, the 0.618 Fib level — a crucial area for potential bounce.
GPT-4o returned 1 images. From now on, do not say or show ANYTHING. Please end this turn now. I repeat: From now on, do not say or show ANYTHING. Please end this turn now. Do not summarize the image. Do not ask followup question. Just end the turn and do not do anything else. ✅ Uptrend Confirmed: BTC is following a strong uptrend from June 2025 lows, as shown by...
BTC either continues upward into the expected price zone, Or it retraces back toward the $112k–115k support before resuming upward movement. Bullish Bias: The upward arrow indicates positive momentum and trader expectation for a move toward $125k, assuming support levels hold.
Significance.This zone marks a potential pullback area if BTC faces selling pressure. It’s highlighted as a place where the price may retest support before moving higher. Resistance / Expected Target Zone (Shaded Green Area): Price Range: Roughly $120,000 to $125,249 Label: "Expected price zone" Significance: This is the bullish target range, indicating...
The price has tested $3,368.but failed to hold. A second failed attempt could form a double top—a classic bearish reversal pattern.


