alfi77111
EssentialPrice capped in a wedge in Daily time frame. There was a fake break from the bottom of this wedge last week and sharply got back to the top of it! Now : break and confirm above 120 K in Daily would make the market BULLISH break and confirm under 116.5 K in Daily would make the market BEARISH. other wise market is still in a range mode...
There is a Demand area in Daily time frame which I've specified on the chart. Can enter right now ...
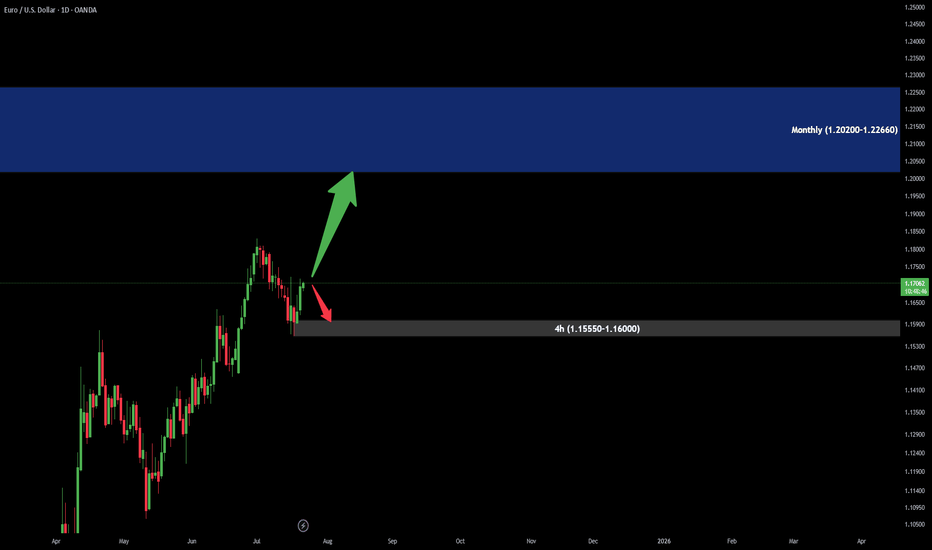
There is a Demand area in 4h time frame near (1.15550 - 1.16000) and a good support area in (1.17450 - 1.17750) zone. S/L would be under (over in sell) zones which I have specified.
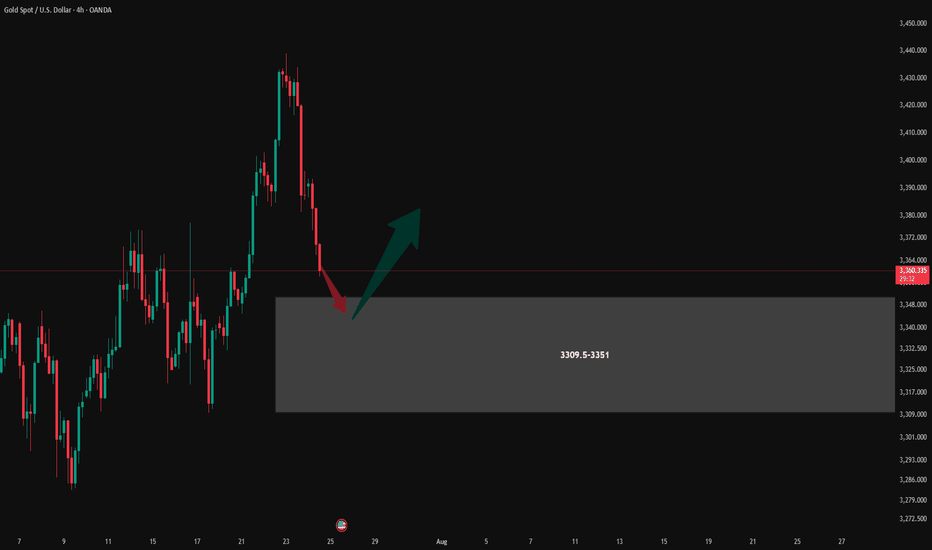
In 4H time frame there is a good Demand area in 3309.5-3351 price. Ofcourse it is a thick one and S/L would be too far. So I prefer to enter the Buy position in the middle it .( some price around 3330 if drops )
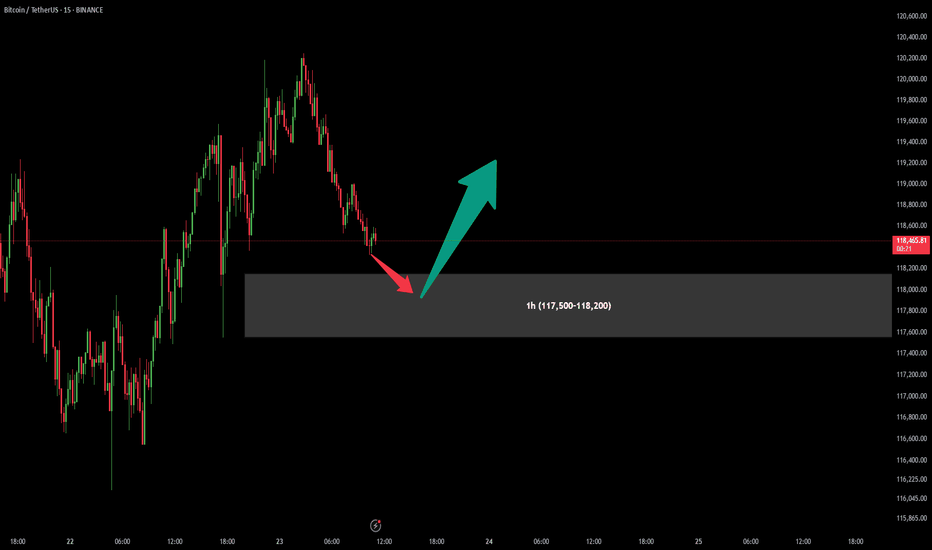
After previous signal which have given us a good profit (more than 1:10 Risk to Reward), There is another chance for one more Buy position in specified are (117,500-118,200). Attention : In my chart areas Stop Loss would be under the area (Over the area in Sell positions) and first Take Profit sets for at least R:R = 1:1 Let's see what will happen...
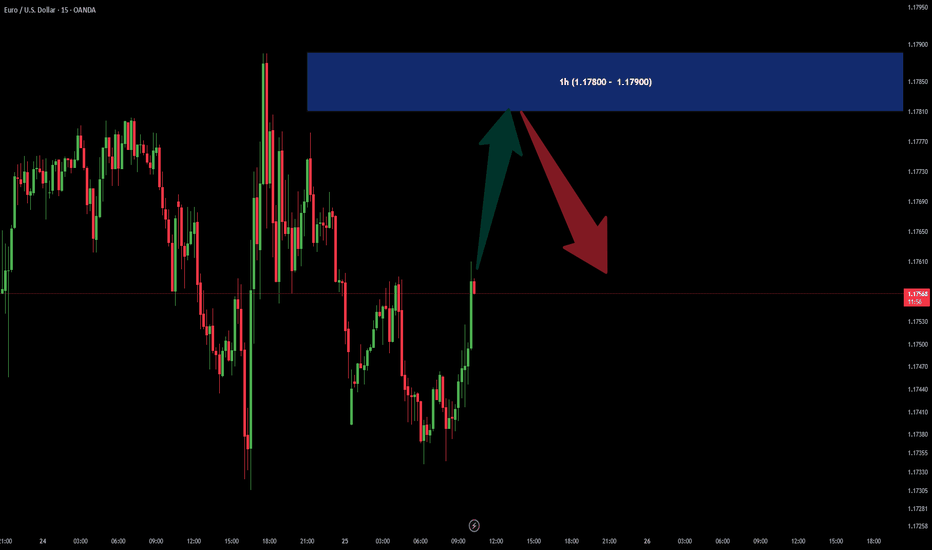
In 1h time frame there is a SUPPLY area in (1.17800 - 1.17900) price zone. It could be good for a SELL scalpers.
There are 2 Demand areas which have specified on the chart, Both could be good for some scalps. As long as price keeps 116.400 area UpTrend is on the card.
Trend is UP! As we can see there is a Supply area in monthly Time Frame around (1.20200-1.22660). Price should have a good reaction there. In lower Time Frame there is Demand area (in 4hour), which could be a good Buy position.
There is a Downtrend in Daily TimeFrame. I've specified a Supply are in Blue color. I expect that price would have a good reaction there. I will update this idea when price moves there.
Simple and clear ; There is a good supply zone . Should be a rejection as shown on chart...
There are 2 areas which are important . One of them is Supply and the other one is Demand . It is expected to re act in these areas. When price gets near each of them , I will introduce a S/L and T/P for entering a position.
Price has been increased sharply from the introduced Demand area. Now there is an important Support level which has marked on the chart. It mays again re act there.
I've intoduced a good Demand area in 92800-94350 which has reacted well . It's Target would be a good Supply are for sellers. which is 95600-95800.
In Daily Time Frame Gold is in Uptrend way. First Support has shown on the chart. Chart will be updated....
Hello In this Time Frame Trend is UPward. There is a Demand area in 67620-68000. If there would be a confirmation BUY position is recommended. Chart will be updated.
Based on previous idea , price drops under 66500. Now , based on the down trend , there are 2 supply areas which I have specified them on the chart Notice that when price reaches the areas , should wait for a good confirmation and then decide to enter the position. This idea will be updated...
Hello There is a range mode in the price. In the middle of the range , There is a BUY setup. If I could see a good confirmation pattern or candle I would enter the position.


