axxxis666
Essential3 possible scenarios, Scenario 1 (Red): If it bounces at 1.272 and fails to break the previous high, a more bearish move is possible. Scenario 2 (Green): This scenario involves a bounce at 1.272 and consolidation above the previous high. Scenario 3 (Orange): This is a continuation of the bearish breakdown. General Notes: All bounce points (indicated by the...
A bullish iH&S/cup&handle pattern is forming. A close above 168 may activate the pattern. Targets are 180, 200 and 220 Invalidation if closes below 157
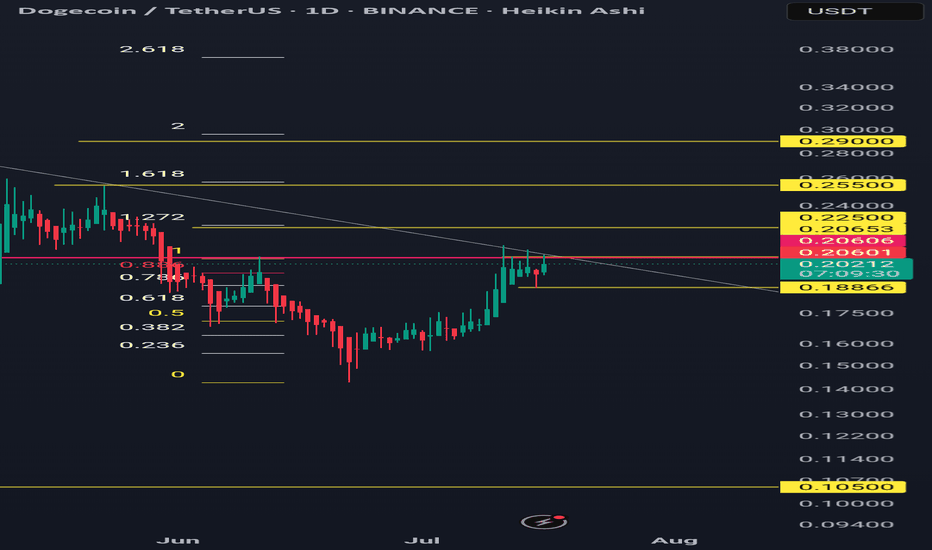
Forming a bullish pattern and a close above 0.206 in daily time frame may activate the pattern. Targets are 0.225, 0.255 and 0.29 Invalidation below 0.1886
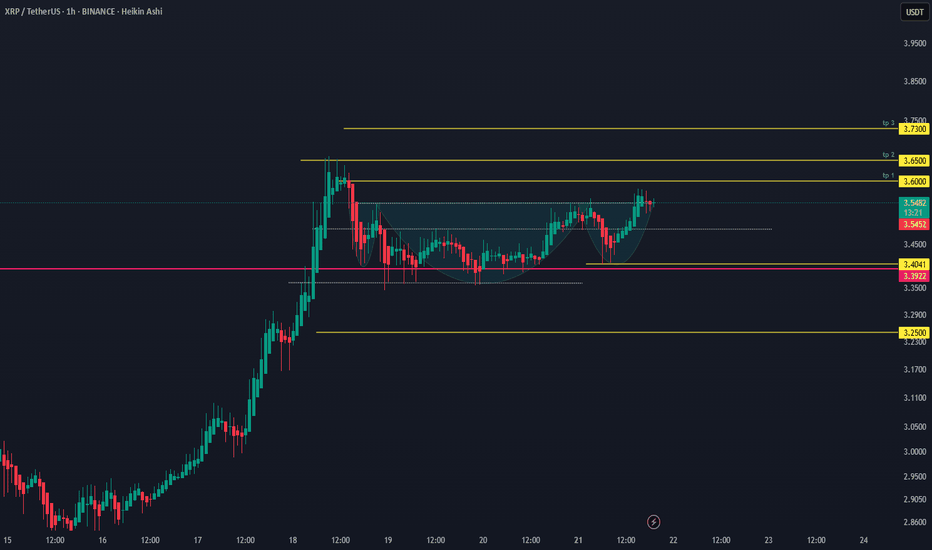
activated bullish patter on top of prev. ATh level. targets are 3.60, 3.65 and 3.73 invalidation: a close below 3.40
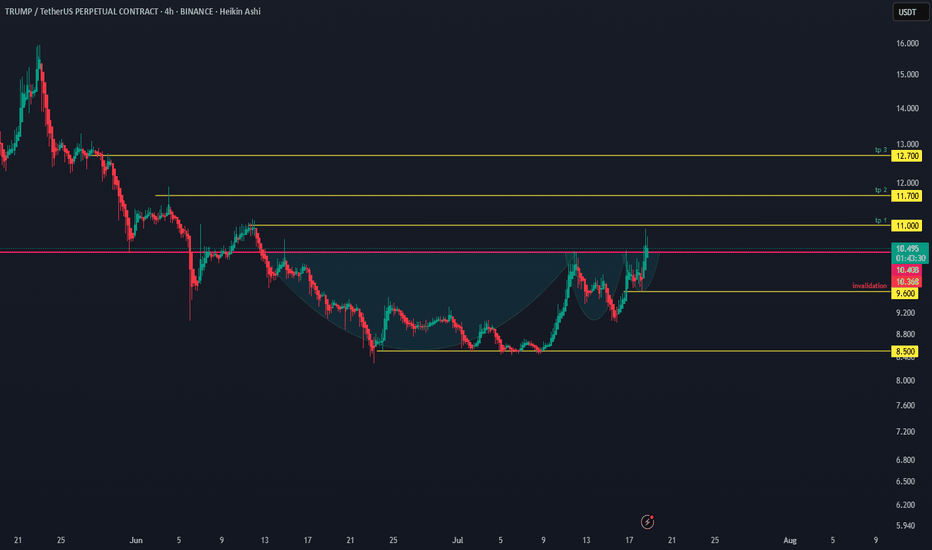
activated cup and handle pattern with targets: 11, 11.7 and 12.7 invalidation: a close below 9.6
An activated iH&S pattern is formed a days ago. Targets are 675, 695 and 720. If the 675 resist its a sign of weakness. Pattern invalidation if closes below 643
Forming a Bullish iH&S pattern, may activate the pattern if closes above 159. Targets are 168, 180 and 198 Invalidation if closes below 144
Comming from shorters take profit area, formed a bullish ih&s pattern. If closes above 108725 in 4hr time, may activate the pattern. Targets are 111500, 115000 and 120000 Invalidation if closes below 105k
Coming from bearish 1st tp area (fib 1.217) from our previous bearish activated pattern " " and now invalidated is a bullish strong move on my POV, as the majority of shorters are taking their profit at the nearest support as sign of fear making a new trend and now formed a bullish ih&s pattern. Targets are 2.45, 2.6 and 2.8. currently trading above 100 and 200...
Ethusdt is forming a big cup and handle pattern in daily time frame. A close above 2850 in daily time frame may activate the pattern. Targets are 3300, 4000 and 5500 Pattern invalidation: A close below 2100
Two scenarios: green and red lines. Green Line: A bounce and sustained recovery above the 100-day and 200-day daily moving averages is bullish. Red Line: A bounce followed by a lack of momentum and a break below a previous low is bearish. Long Horizontal Red Line: If the price reaches this area, it could signal the start of a downtrend unless new bullish...
If we take a look at weekly time frame btcusdt has formed a bullish cup and handle/ iH&S pattern and the nearest take profit area is the 120k. It is a good tp area for short term traders.
A bearish head and shoulders pattern is forming. If it closes below 2.0811 on the 4-hour timeframe, the pattern may be activated. Targets are 1.95, 1.80, and 1.65. Invalidation occurs if the high of the right shoulder (2.3355) is broken.
A bearish head and shoulders pattern is forming. If it closes below 141.54 on the 4-hour timeframe, the pattern may be activated. Targets are 132, 120, and 108. Invalidation occurs if the high of the right shoulder (168.22) is broken.
BTC is still in an uptrend but in a consolidation phase. However, many altcoins appear to be outliers and are significantly weaker when BTC is in a pullback phase. One of them is XLM/USDT, which is trading below the 100 and 200 MA on the daily timeframe. A close below 0.25267 on the 4-hour timeframe may activate the pattern. Targets are 0.215 and...
Starting to form a bearish pattern in daily time frame, still not complete/confirm. Trading below 100 daily ma.
The pattern is not yet complete, but if it makes a new bounce and retests again, it will attract bearish traders, increasing the likelihood of a breakdown. A close below 0.1865 on the 1-hour timeframe will confirm the pattern. This level also serves as the invalidation point for long entries and the final take-profit (TP) from the previous bearish...
If it closes below 2.0811 on the 4-hour timeframe, the bearish head and shoulders pattern may activate. Targets are 1.8 and 1.65. Invalidation occurs if it closes above 2.2829, assuming it didn't make a new high above that level before dropping down. It is currently trading below the 100-day moving average.


