borschenkovitc
Hello friends! It's time for our beloved Nasdaq index to cool down. I expect a correction amid the strengthening of the dollar. H4: clear Double Top forming near 23,000. Daily: bearish MACD divergence confirms momentum shift. 📐 FRL (H4): neckline at 23,000, perfectly aligned with 100 SMA on H4. 🎯 Target: 0.618 Fib retracement at 20,500 – confluence with 100 &...
Hi everyone! Ethereum – Double Top with Bearish Divergence On the 4H chart, ETH is forming a clear double top while MACD prints a strong bearish divergence, signaling momentum loss. 📉 Neckline: $3,500 – this level acts as the key trigger. 🔻 Target: $3,000 – aligns with the 0.618 Fibonacci retracement and previous demand zone. A confirmed break below $3,500 would...
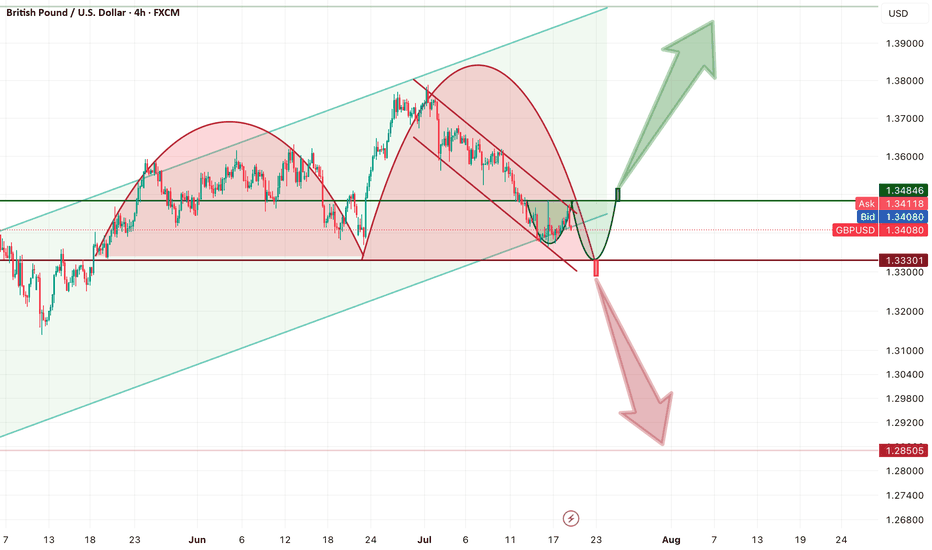
The GBPUSD chart is presenting a rare moment of confluence and clarity — the perfect environment for a high-probability reversal. The market is pressed against a crucial decision point, and the coming breakout will define the next major trend. Let’s get into the structure: Key Structure: Double Bottom or Continuation? We are currently inside a local corrective...
We have a clear descending channel (wedge) on H1, with the price testing the neckline level after a corrective consolidation. According to Fractal Reversal Law (FRL): The neckline is drawn horizontally at the start of the last impulse, not on the top of the candle wicks. The price has retested the neckline multiple times, forming a clean structure before...
Trading = capital management under uncertainty. Bitcoin is trading inside a clear descending channel on H4. Price recently tested the upper boundary of this channel while forming a bearish divergence on MACD. This divergence hints at a weakening upward phase, signaling a possible phase shift according to Fractal Reversal Law (FRL). Why is this a classic FRL...
We have two descending wedges on USD/CAD across different timeframes: H1: Clean falling wedge structure since March, price near the lower boundary. H4: Same wedge structure, aligning with the larger phase. FRL Entry Confirmation: Following the Fractal Reversal Law (FRL), we do not enter immediately. We wait for: ✅ A full candle close above the neckline of the...
Gold forms a clean double bottom after a correction within an upward channel. The neckline aligns precisely with the 100 MA – a classic Fractal Reversal Law (FRL) setup, indicating a phase shift back into the bullish structure. Why This Setup: ✅ Trend Structure: Gold remains inside its upward channel, respecting each phase with corrective trends that end with...
“Trading is capital management under uncertainty. The red horizontal zone is the zone of uncertainty. Neckline levels are rubicons — thresholds where the market becomes clear to us. Don’t fear uncertainty. Learn to wait for the moment when everything becomes clear.” Right now, gold is forming an upward trend. But as we know, every trend consists of impulses and...
Two major FX pairs — EURUSD and USDCAD — are currently forming highly symmetrical, yet opposite structures across multiple timeframes. Each pair reflects the logic of the Fractal Reversal Law (FRL), where every phase of market movement is concluded by a reversal figure, and the neckline of that figure aligns precisely with the MA100. EURUSD: – Rising wedge on the...
Monero: The Hidden Signal of Altseason — A Fractal Reversal Confirmed Across Markets and Timeframes While the market is still chasing noise from meme tokens and hype narratives, Monero (XMR) is silently building one of the cleanest structural setups I’ve seen this year. And it’s not just happening on one chart — this setup is being confirmed across multiple...
## 🟡 Gold (XAU/USD) – Between Double Bottom and Double Top: Waiting for Breakout Confirmation This is a clean multi-hour setup with **two classic reversal patterns** forming in opposite directions. I’ve highlighted both with color-coded bars for clarity: - 🖤 **Black bars**: Potential **Double Bottom** - 🔵 **Blue bars**: Potential **Double Top** --- ### 🧠...
In my () I outlined a classic double bottom with bullish divergence on the daily chart — Ethereum followed the structure precisely and triggered a clean breakout. ✅ Now What? The first impulse is already behind us. Historically, after a double bottom breakout, price often enters a bullish continuation phase — most commonly forming a rising flag. 🟩 The...
In my previous post, I highlighted a massive double bottom on the EUR/USD monthly chart, potentially signaling the birth of a multi-month bullish cycle. Now, zooming in to the H4 timeframe, the pair is trading in a key decision zone ahead of the FOMC rate announcement on Wednesday. Decision Zone: 1.1200–1.1400 This range is technically dangerous for new...
For the first time since 2008, EUR/USD is showing signs of a potential long-term trend reversal. The pair has broken above the descending channel that has defined the bearish structure for over 15 years. But this is not just a technical breakout — the fundamentals support this move as well. The U.S. dollar remains under pressure as the market shifts its rate...
A powerful bullish setup may be forming on ETH — but confirmation is everything. Watch how the falling wedge, double bottom, and MACD divergence align for one of the cleanest potential long opportunities. Ethereum is now shaping a potentially powerful reversal structure, combining a falling wedge, a possible double bottom, and bullish MACD divergence. The price...
Some thoughts on the price of bitcoin in the context of a logarithmic scale.
Welcome to the recession. All ingenious is simple. And I'm not talking about my genius. This is the genius of Fibonacci and Benoit Maldebrot.
Fibonacci levels in work. Now we get 1.68 During this or next day we can move to 1.00 (amount 36000) There is nice resistance zone with volumes for LONG Thanx for attention


