ceciliones
PremiumDon't forget to add LINK to your watchlist — it's a solid project with long-term investment potential. The weekly chart shows that LINK is currently retesting the downtrend line it recently broke — a textbook bullish retest. The lower trendline now acts as a key support level, and as long as price holds above it, the structure remains healthy. Currently trading...
The symmetrical triangle pattern on the monthly timeframe is showing signs of weakening after multiple failed breakout attempts — and now, a breakout seems highly likely. Once SOL breaks out of this triangle, it will enter price discovery mode , opening the door to a massive bullish move. At that point, most traders will start saying “it’s too late”, while SOL...
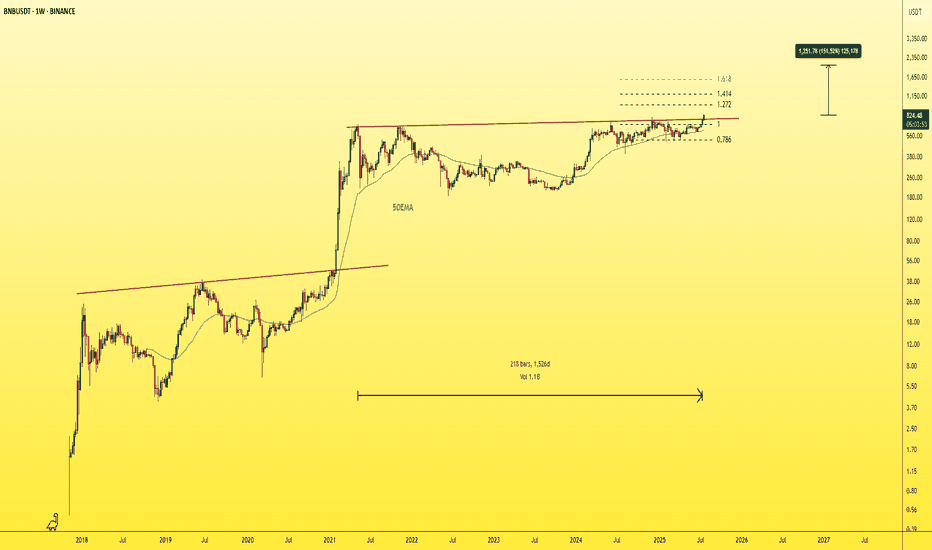
"The strongest resistance level on the chart has just been broken — which was represented by the previous ATH — after nearly four attempts. This exact pattern occurred before in 2021, and what followed was a parabolic rally. The same scenario is unfolding now! You’ll soon see BNB trading in four digit When the crowd doubts — the smart money loads up. Expect a...
Ethereum is currently the strongest and most stable asset in the market, especially after many had lost hope in it. Now, Ethereum is back with strength, and it’s just a few steps away from breaking out of the current pattern. 📈A breakout above the upper boundary will likely lead to a new all-time high (ATH) for ETH. My projection: Ethereum could surpass $7,000...
The last candle on the daily chart just confirmed a BOS (Break of Structure) — a clear and strong sign of bullish continuation for the asset. ✅ This is a textbook entry for a long position. 🎯 Next target: $5 — and so far, no bearish signs in sight. Best regards, Ceciliones 🎯
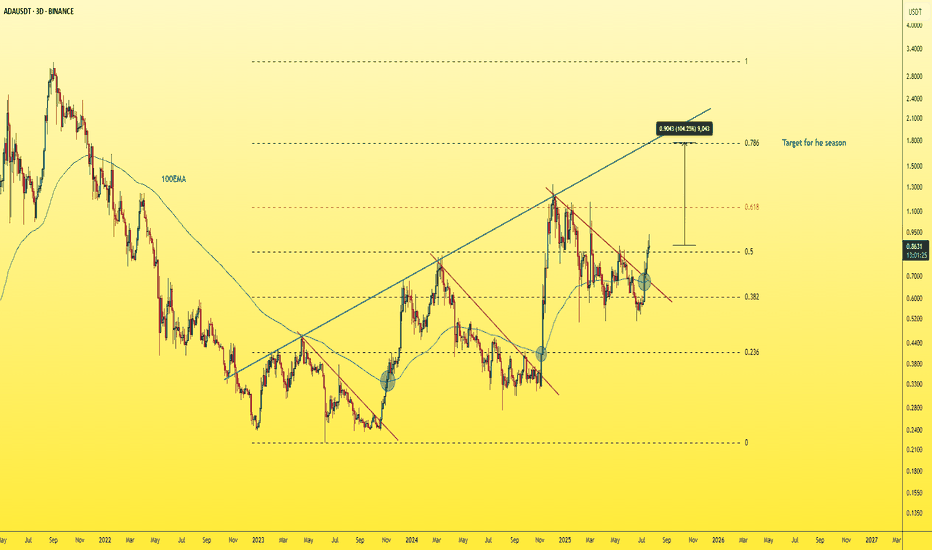
As clear and simple as the chart is… the target is just as clear and reliable. ADA is showing strong bullish structure on the 3-day chart — breaking above the red trendline with a successful retest, and also breaking above the 100 EMA. The blue trendline represents a strong hidden resistance level that many traders are overlooking. The upside move is likely to...
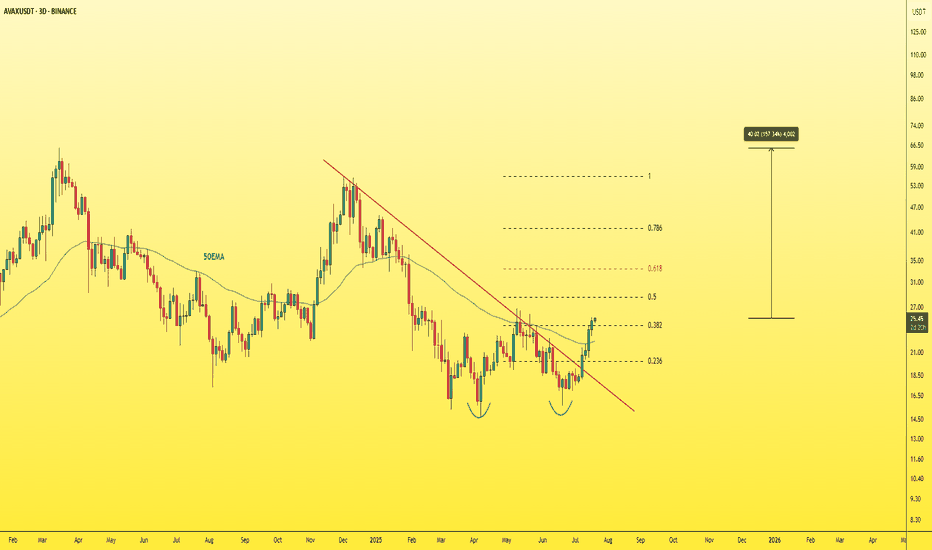
Let's not forget about CRYPTOCAP:AVAX — it's one of the must-have assets in any crypto portfolio. Currently trading at a discounted price after dropping from its previous top at $55, AVAX now shows strong bullish potential with plenty of upside ahead. 🚀 Key bullish signs: -Successfully broke through multiple resistance levels, including the 0.382 Fibonacci...
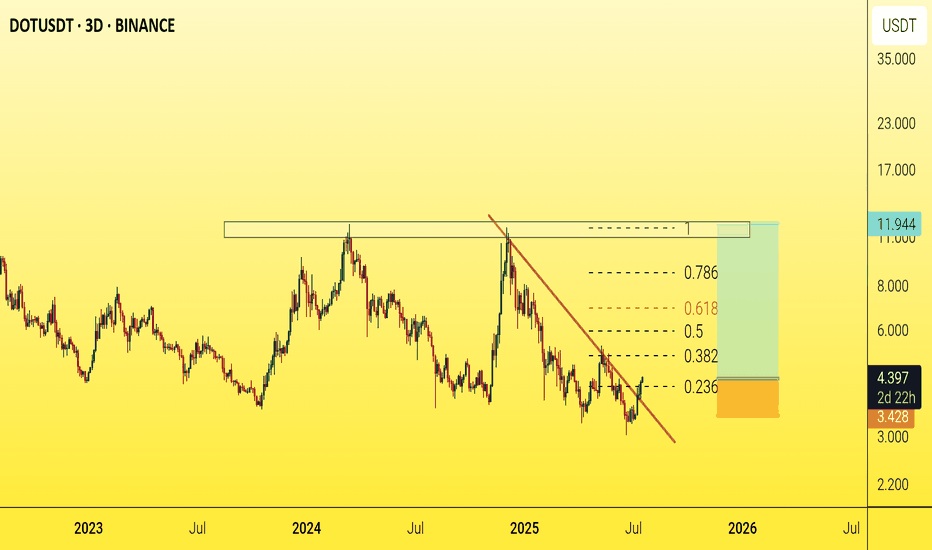
Polkadot (DOT) has always been one of the leading assets during bull markets A $10 target now seems inevitable after a clean breakout above the main trendline, followed by a successful retest.🎯 This $10 level has historically acted as a major resistance zone, often manipulated during each bull cycle — price touches it, then sharply pulls back. But the big...
🔸Introduction: In financial markets in general—and the crypto market in particular—understanding market liquidity and imbalance zones is essential for building successful trading strategies. One of the most prominent modern price analysis concepts, especially within the Smart Money Concepts (SMC) framework, is the Fair Value Gap (FVG). This refers to a price...
Over the past 3 years, I’ve noticed that Bitcoin has been moving in a consistently bullish pattern, as shown on the chart. After breaking out of the red ellipse shape, Bitcoin tends to rally strongly—and that’s usually the signal for altcoins to follow. We’ve now broken out of this ellipse, and it looks like the real bullish move is just beginning. In this...
- On the 3-day chart, XRP displays a breakout from the bullish pennant pattern, with a target implying nearly 200% upside from the breakout point — which aligns perfectly with the Fibonacci level 2. - Additionally, price has broken above the neckline of the inverse Head and Shoulders pattern, further confirming bullish momentum. -From an Elliott Wave...
The Ethereum season has arrived, and in the coming days, we'll be focusing on Ethereum and the tokens built on its network. The chart shows a descending broadening wedge pattern, which has been broken on the daily timeframe. Don’t wait for a retest or any major corrections—this train won’t wait for you. The target for this pattern is $6,600. Best regards Ceciliones🎯
The upcoming wave will be directed toward all Ethereum-based tokens, with ARB being one of the most significant. On the 3-day timeframe, you’ll notice it has broken the downward trendline with a giant bullish candle, signaling a trend reversal from bearish to bullish. It has also formed an inverse Head & Shoulders pattern, a strong bullish signal. While the...
On the weekly timeframe, the downward trendline has been broken and successfully retested. A strong move upward is just a matter of time… Notice how it bounces hard every time it touches the support zone marked by the grey rectangle — this has happened three times in a row. Also, FIL has been in an accumulation phase for around 1,092 days — that’s nearly 3...
It already made a 100% move from the zone we mentioned earlier, breaking the downtrend line with a massive bullish candle on the 3-day timeframe. It’s now on its way to forming a new all-time high (ATH). Best regards Ceciliones 🎯
A nice bounce occurred as soon as it touched the legendary support — the primary trendline and the grey zone. Just look at the price behavior every time it approaches this rectangle. You'll notice that, based on the Elliott Wave Impulse, Wave 4 has likely completed, and we’re now entering the final impulsive leg — "Wave 5" $100 is a very modest target in the...
Ethereum has dropped 65% since December, hitting its bottom in April — that’s 5 full months in a bear market with a massive drawdown, especially for the second-largest crypto by market cap. Today, it made a strong bounce, rallying over 50% from the grey support zone, confirming that the bottom was likely in. Looking at the RSI, Ethereum has entered the oversold...
Bitcoin dominance continues to rise after breaking out of a rising wedge pattern on the weekly chart. It has now also broken through the 0.786 Fibonacci level. Next stop is Rectangle 1, where Bitcoin dominance is expected to reach 68% — and most likely, this will mark the top of dominance before it starts to drop, triggering a historic altcoin season. Scenario...


