cryptodailyuk
Ultimate📈 Trend and Market Structure Current trend: Upward (higher lows and highs) The price is moving within an ascending price channel, marked by two black trend lines. The recent rebound occurred from support around 14.83 USDT, which coincides with the lower boundary of the channel. 🔍 Key Levels ✅ Resistance (green horizontal lines) 18.98 USDT – local high 21.16...
🔍 Technical Structure 📉 Descending Channel (orange lines) The price was moving in a clear downtrend within the channel. A breakout from the channel to the top occurred, which is a potentially bullish signal. The price is currently testing a level above the channel—a classic retarget (retest) of the breakout. 🟩 Support/Resistance Levels (green and red lines) ✅...
🔍 General Technical Context: Prior Trend: Upward (strong rally from around 3,150 USDT). Current Structure: After breaking out of the ascending channel, there was a strong decline, but is currently rebounding upward – it looks like a test of prior support as resistance. 📈 Key Horizontal Levels (Support/Resistance): Resistance: 3,794 USDT – strong resistance...
🔼 Resistance: • USD 123,263 - local peak, strong resistance (green line) • USD 119,120 - level tested several times, recent reflection • 116,224 USD - zone of previous consolidations 🔽 support: • 110,945 USD - SMA #2 (movable average), tested in the past • 107,804 USD - local hole • USD 103,542 - strong support from the past (historical retention of...
🔸 Formation: Triangle descending (descending) • Upper trend line (orange) - inheritance, connects lower and lower peaks. • Lower support line (red) - approx. 116,700 USD - key support, tested many times. 🔻 Support USD 116,700 Tested several times, currently threatened 🔻 Another support USD 114,669 Target level when struck with a triangle 🔼 Resistance ...
📉 Short-term situation: The price is currently trading around 2028 USDT, after a sharp decline from around 2273 USDT (resistance). The support level around 2000 USDT is currently being tested (coinciding with the SMA 200 – blue line). A dynamic uptrend line (orange) is also visible, which could act as a key support level in the event of further declines. 🔍...
📉 Price Current price: approximately $183–$184 We see a decline from the resistance zone around $194.56. The price has broken through support at $187.31 and is heading towards lower support at: 🔴 $183.18 – local support (being tested now), 🔴 $175.58 – key support (potential target if current support breaks). 📊 Market structure Short-term trend: Downtrend (lower...
📊 General Context Ethereum is rising in a strong short-term uptrend, supported by a rising trendline (orange). Current price: 3831 USDT We are approaching a significant resistance level around 3842–3850 USDT (green line). Technical support is located around 3760 USDT (previous consolidation level and 50/200 SMA). 🔍 Technical Levels Resistance: 3842–3850 USDT –...
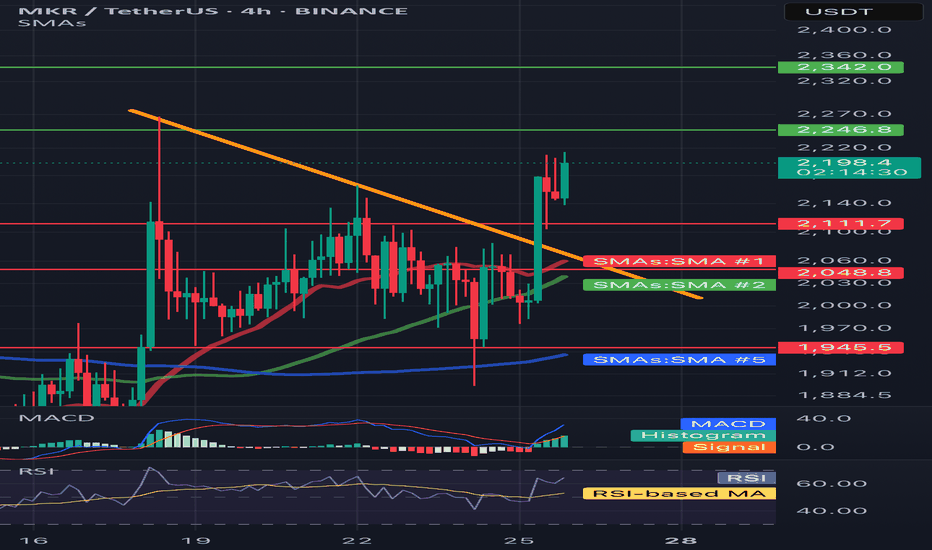
📈 Trend and price structure • The price has just been above the downward trend line (yellow line), which suggests the potential reversal of the trend to the upward. • Breaking was strong - a candle with a large growth volume and an increase +9.13%, which emphasizes the pressure of buyers. ⸻ 🔍 levels of support and resistance • resistance: • ~ 2342 USDT...
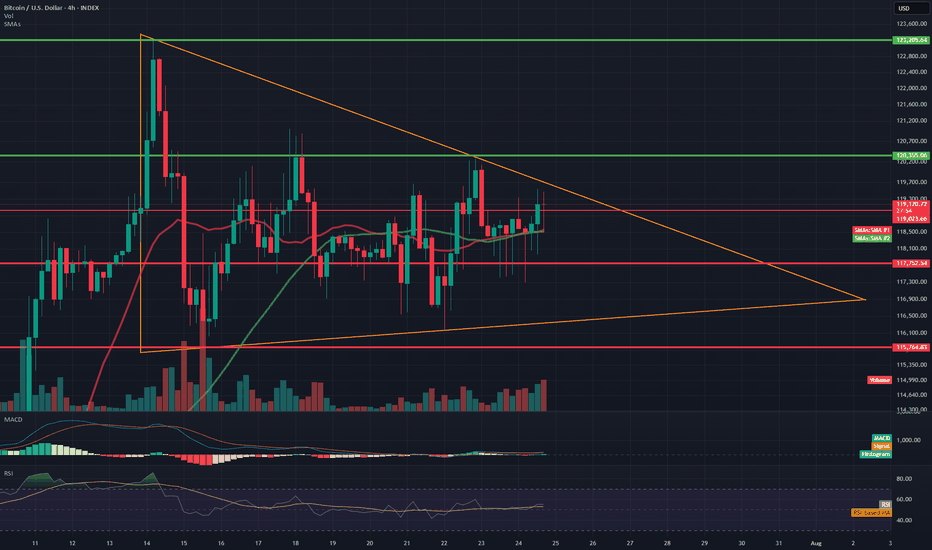
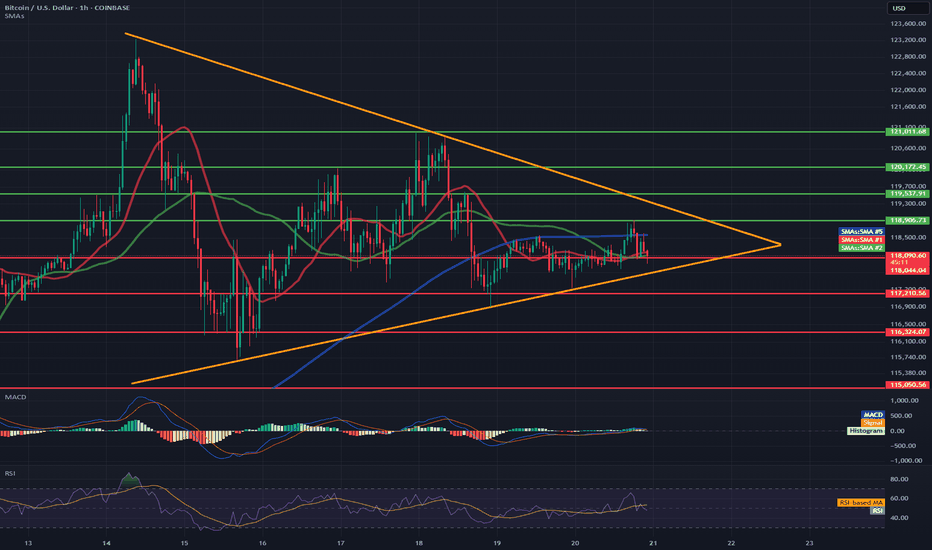
📊 Technical Structure (Symmetrical Triangle) Formation: The symmetrical triangle (orange lines) remains intact—price continues to move within it. Approaching the apex: The closer to the intersection of the triangle's arms, the greater the probability of a breakout. The current candle is testing the upper boundary of the formation (around $119,300), but has not...
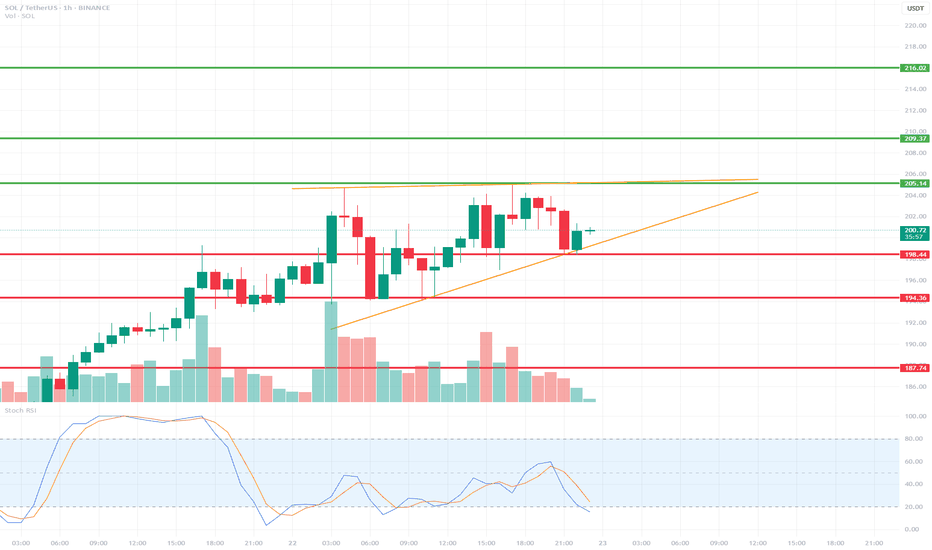
🔍 Technical Structure: Short-Term Trend: SOL is currently in an uptrend, with local higher lows. This is evident from the orange uptrend line, which has been tested multiple times. Local Resistance: 205.14 USDT – yellow line – a resistance level that the price has touched several times but failed to break (this could be a double-top formation). Local...
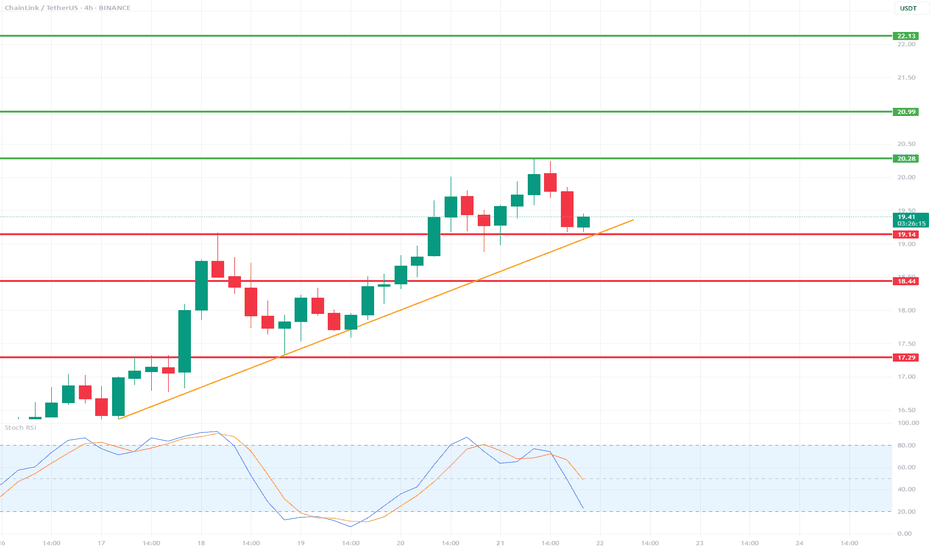
📉 Indicators and Market Structure: 🔶 Trend: Current trend: up, as long as it remains above the trend line and the 19.14 USDT level. Local resistance: 20.28 USDT (recent high). Next resistances: 20.99 USDT and 22.13 USDT (green lines). Supports: 19.14 USDT, 18.44 USDT, 17.29 USDT (red lines). 🔷 Stochastic RSI (lower indicator): Located in the oversold zone...
🔷 Pattern: Symmetrical Triangle (Consolidation) The price is inside the triangle formation (orange lines) and is approaching its completion. An impending breakout (up or down) is highly probable within the next few hours. 📉 Support Levels (red lines): 117.210 – local horizontal support. 116.324 – 115.050 – strong demand zone (potential target in the event of a...
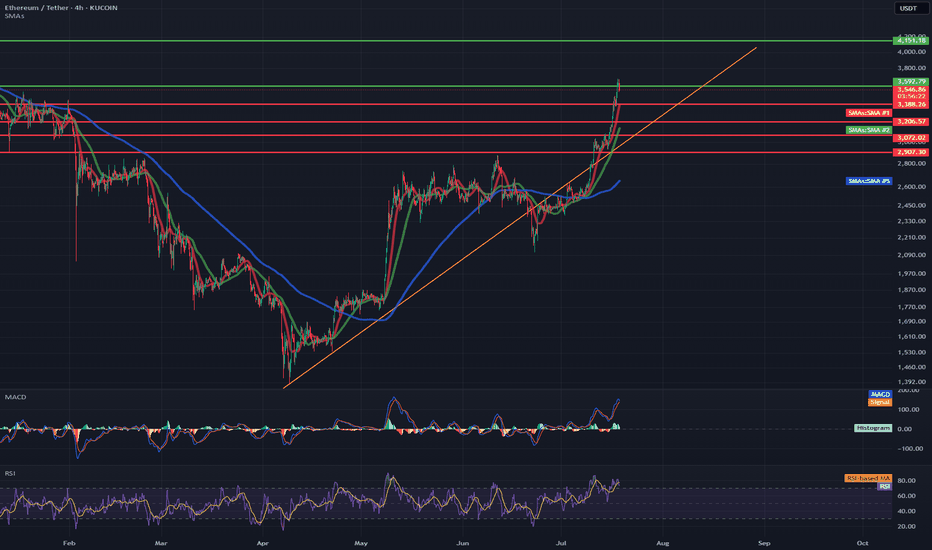
✅ Market Trend and Structure: Uptrend: The highlighted orange trend line shows continuous growth since mid-April. The price is trading above the 50- and 200-period moving averages (EMA and SMA), confirming bullish sentiment. Current price: around 3556 USDT – very close to local highs. Resistance break in the 3200–3300 USDT area, which now acts as support. 📈...
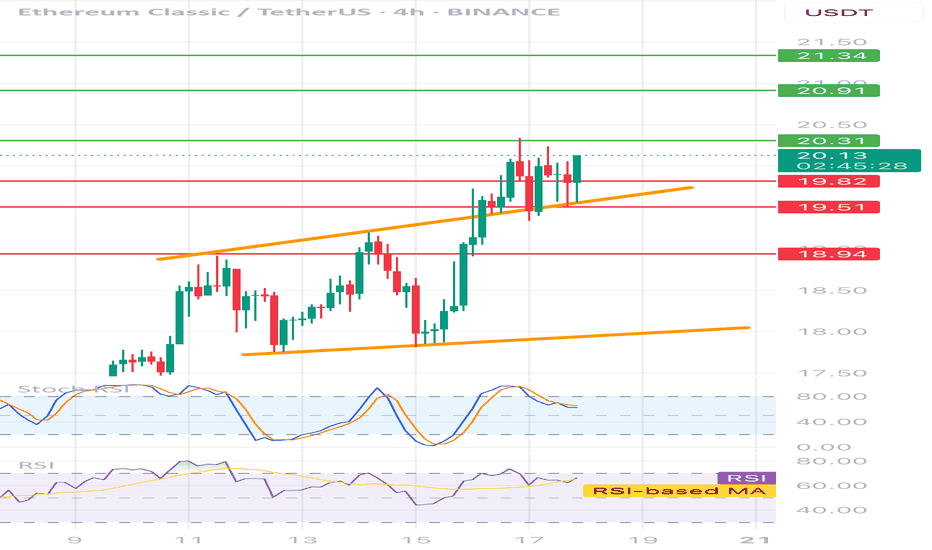
📊 Price: Currently around 20.05 USDT ⸻ 🔶 Technical formation: • Ascending channel - clearly marked with two orange trend lines. • The price is currently testing the upper edge of the channel - it is possible to break or correction. ⸻ 📉 Support and resistance: • ✅ Support: • 19.73 (local, on the closure of the candles) • 19.51 (technical, tested...
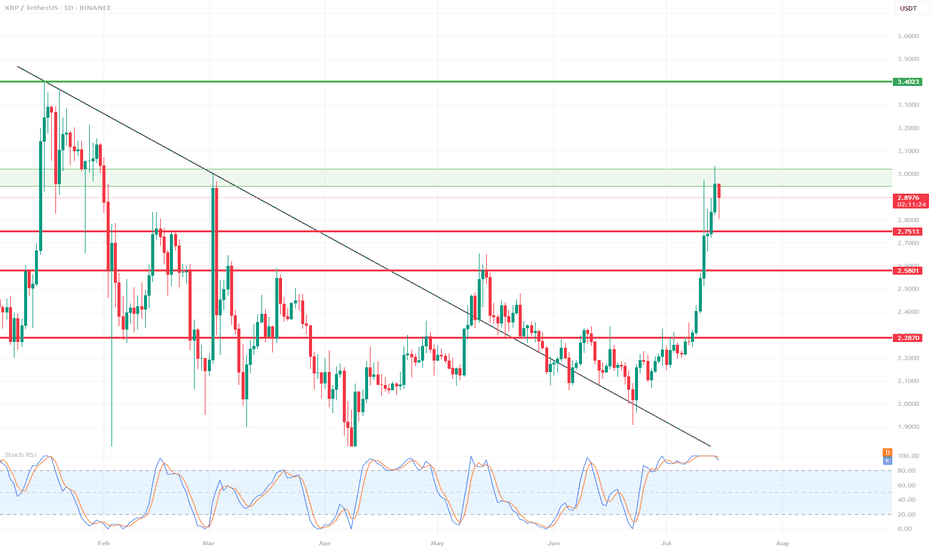
📊 Support and Resistance Levels: 🔼 Resistance: $2.95 - $3.02 – currently being tested, a local resistance zone. Price slightly rejected. $3.40 – another strong resistance level from the previous high (visible on the left side of the chart). 🔽 Support: $2.75 – the closest, recently broken support level. $2.58 – another local support level. $2.28–$2.30 – a very...
🔍 Trend: The short-term uptrend remains in effect, supported by the orange trendline. The price has tested dynamic support but has not yet broken it. 🟥 Supports (Important Levels): 🔻 1. 119.550 Key support. The price is currently testing it. Holding = potential upside rebound. Breaking = greater downside risk. 🔻 2. 117.260–118.040 USD Clear demand zone...
🔻 Trend: • Currently visible inheritance channel - confirmed by the yellow inheritance trend (decreasing peaks). • The price tests resistance in the area 117.564 - possible to break out, but requires confirmation of the volume. ⸻ 📊 levels of support and resistance: • resistance: • 117,564 (here we are now - resistance test) • 117,939 • 118,206 (key...


