dRends35
PremiumA video made public to show my work - Taking a look at ADA HBAR and RNDR also considering bigger picture - Bitcoin and S&P
BTC / M2 Global Liquidity (Offset 78 days) History did repeat and the standout Shooting Star has again led to significant dump action as it . And the fact that this is happening while stock indexes are wobbling while Trump unleashes more tariffs - should be a cause for concern. But to lighten moods, I have added M2 Global Liquidity. To remind, there has been...
Just one of many coins that I am picking in this area. But these meme coins can have some pop - and so this is one I share with TradingView. It had once nice push up (arrow) - signalling it has plenty of bullish potential. The low time frame is choppy but the candles are both narrowing and shallowing - I think this may be building pressure for a next wave...
ETH TOTAL ETH wicked into higher liquidity above the previous peak just as TOTAL hit the sweet spot just below 0.85 (for retracement completion). So, if you're into the short term game, then this is a great moment to take some profit on ETH. Even if it goes higher there are decent odds that it will be lower or even very lower at some point. And even if you...
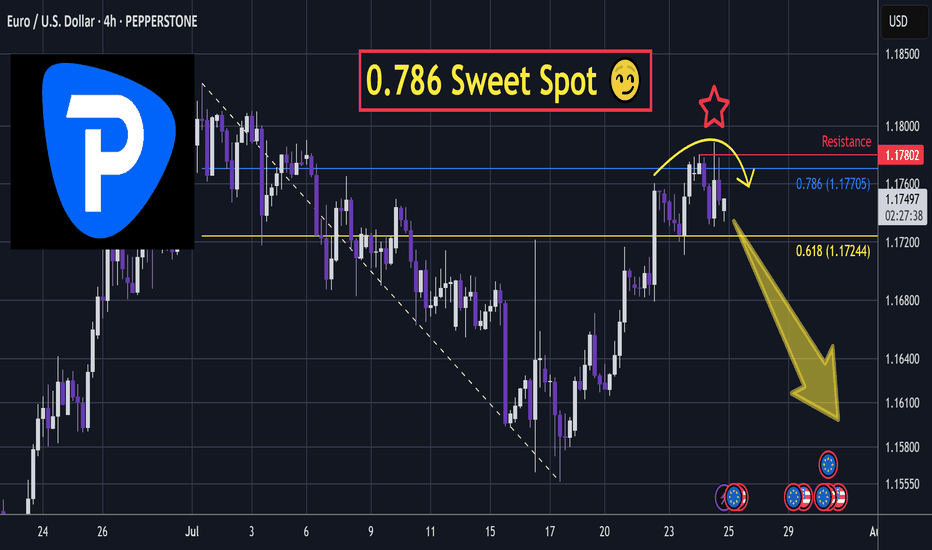
This bounce is likely to be a connective wave into another wave down. In the video I break down a classic algo driven liquidity sweep just above the 0.786 retracement. This signals potential reversal. Stop loss placement depends on how aggressive you want to be with margin. Tighter risk gives more upside potential with defined exposure. Invalidation of...
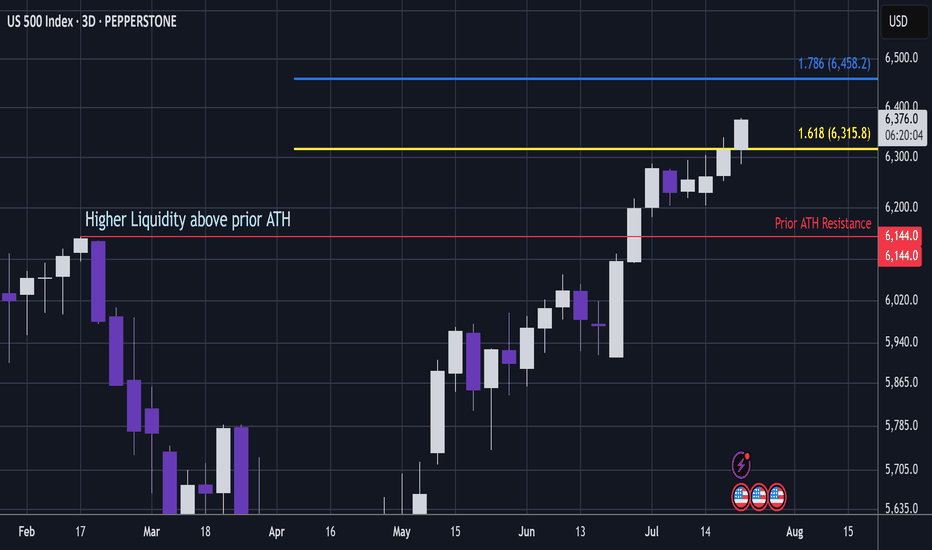
S&P (Pepperstone CFD) Price has popped above the 1.618 extension, which is a key ratio zone. A bearish whipsaw in this area could be dangerous. However, if price continues to push through this level, it signals that S&P is entering a very bullish phase. The area above prior ATH resistance holds high liquidity. If price moves beyond this ratio band, it will...
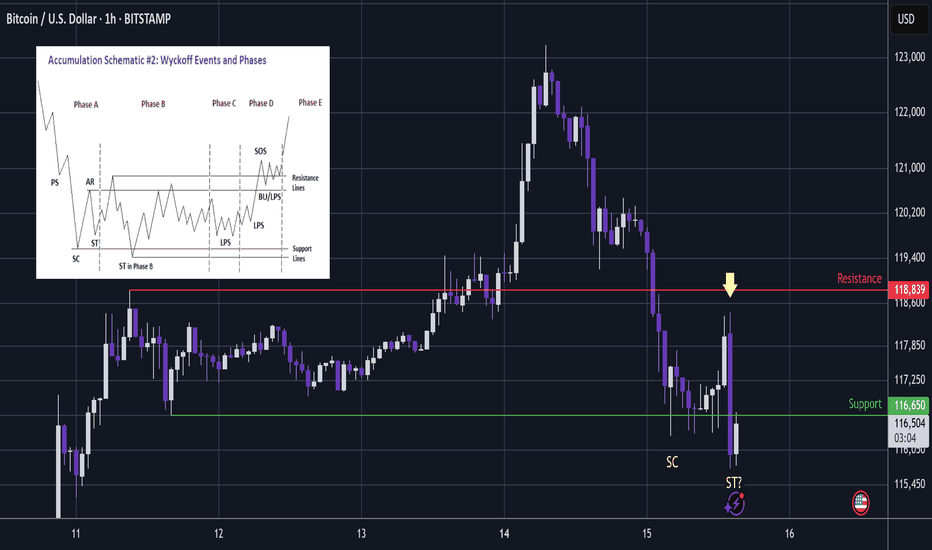
BTC Various threats since the impulsive high: - Impulsive downtrend. - Weak 3 wave correction with shorter thrid wave printing a bearish liquidity sweep. - Second impulsive downtrend. But this has stopped tidily in the retracement Golden Window and now drifitng sideways. It appears to be building pressure for the next move up 👍. This analysis is shared for...
Showing the exact dip buy and the exact sell point is not something I will do regularly here. But on this occasion I have done it here to showcase more of the winning multi layered method that I use. Bitcoin dumping as I write. Could yet bounce, but i'm happy to have taken some profit on altcoin pumps. At the end of the day - as long as you're regularly making...
Whenever there is a big impulsive rally, dumb money will come rushing in to buy. And thus we can somewhat expect the market maker to print a shakeout for them to exit at best price and dumb money to carry the bags at worst price. ... In this area we have multiple charts providing the liquidity zones for the shakeouts: The upside shakeout (long wick) printed on...
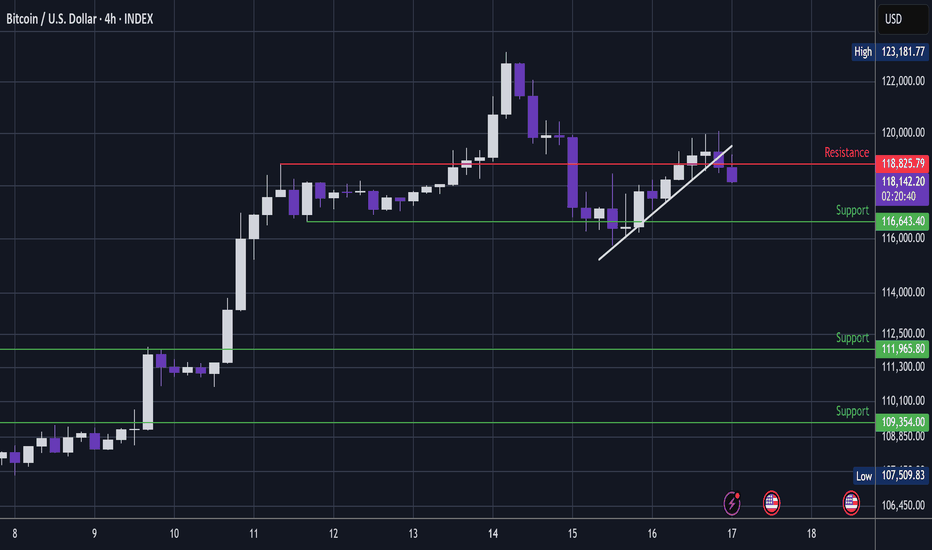
Plenty of rotations in altcoins with SOL rotating to weakness in this area. This is while Bitcoin breaks the ascending line; and we'll have to see what type of dip it is... This slightly higher high and Evening Star candle pattern is quite a bearish look. If Bitcoin was more bearish, you could look at this and consider that it may be a major pivot before a...
I made a video already today with 2 coin setups in great areas. But here's a nice and simple high rank bone for TV'ers. Nice contraction pattern. Nice breakout. Can go up and up from here 👍 Check my crypto video if you enjoy depth TA - linked to this thread. Not advice.
13 minutes of video; looking at Bitcoin, TOTAL, altcoins. HOT breaking out now! - Trade setup in video. See you @ BTC $174K! Not advice
BONK #50 Just hit the reverse 2.272. Most coin charts are either flat or bearish here so BONK has been pumping against the overall market. This ratio is an algo favourite. Alerts set above the 2.414 as invalidation but it could go a little higher and still be fine. That said, I am looking for this to be a tidy catch. There is no significant bearish wick as...
This days candle has 8 hours until close... But notice that the long lower wicked candle has instantly been met with an upper wicked candle. Prior to the current candle there was; - A long 3 wave correction (May - June) with a very long lower wicked candle at the bottom (orange arrow) then - Another lower wicked candle as the first pull back of an uptrend...
Here's a 20 minute TA. Quite a complex area - enjoy 👍. This analysis is shared for educational purposes only and does not constitute financial advice. Please conduct your own research before making any trading decisions.
COIN Is suddenly slumping from a major point of high liquidity: - It is above ATH resistance - It is hitting a long term ascending trendline take from the first two significant peaks of the bull trend. - It has pivoted within a reverse 2.272 Golden Window (up to 2.414) taking the 2 pivots at the base of the minor degree uptrend. Coinbase has been on a...
MARA Similar to Bitcoin , MARA bounced from a 1:1 extension: And so a 3 wave correction completed in symmetry. So on MARA chart , from April lows we have; - A weak 1:0.618 (GW) 3 wave upside bounce (blue line). - A shallow and descending 1:1 3 wave correction (yellow line). - And a 0.5 retracement bounce. The bounce is weaker than Bitcoin and overall...
5 minute TA and psychological video on crude oil. I am short. Not advice


