dan411vm
Double bottom on gold with RSI regular divergency on 5 , 15 and 1 hour chart. It seems like buyers are interested again on this level.
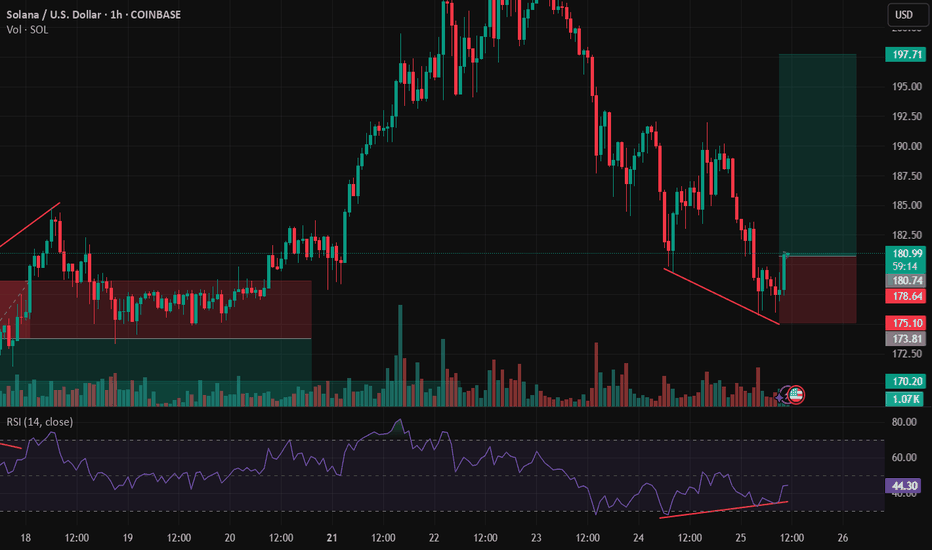
Double bottom with RSI regular divergency. It seems that buyers a willing to buy at this level again.
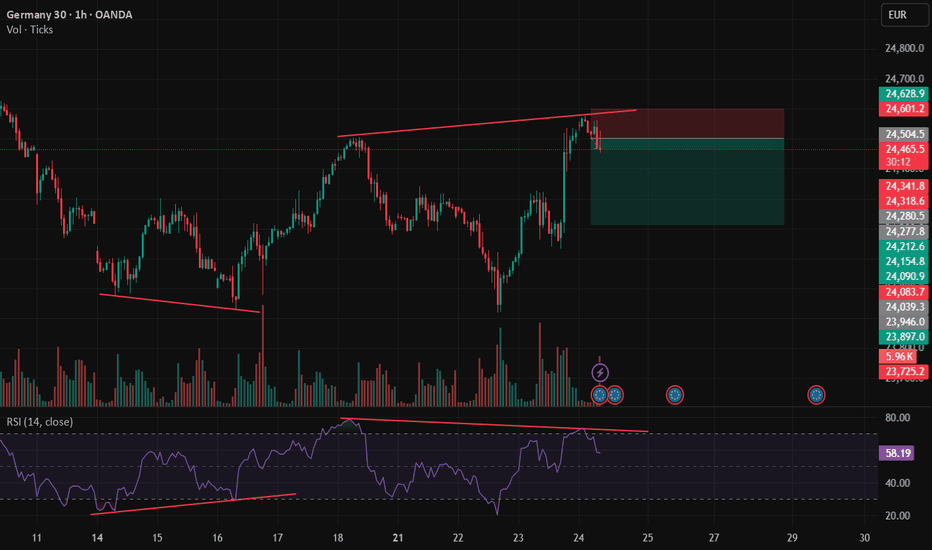
Double top on the Dax with RSI regular divergency. If are feeling brave enough you could let this run all the way down to 24k.
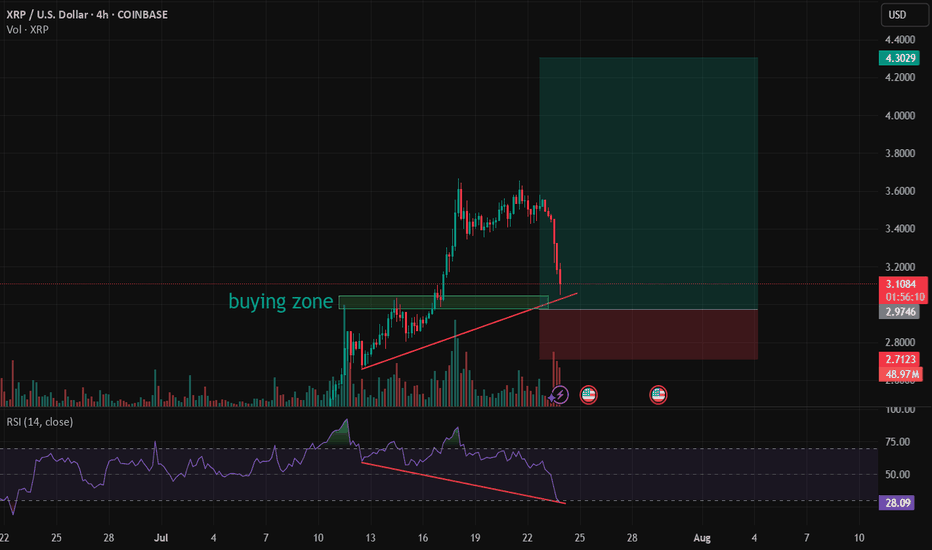
This set up is not usually on my playbook but seen the strong momentum the XRP is having, this hidden divergency is as good as it comes, with good potential to workout. I believe if it does the first target will be around 4.30.
Double bottom on the Dax with a RSI divergency. There's a good possibility the trend will resume from here.
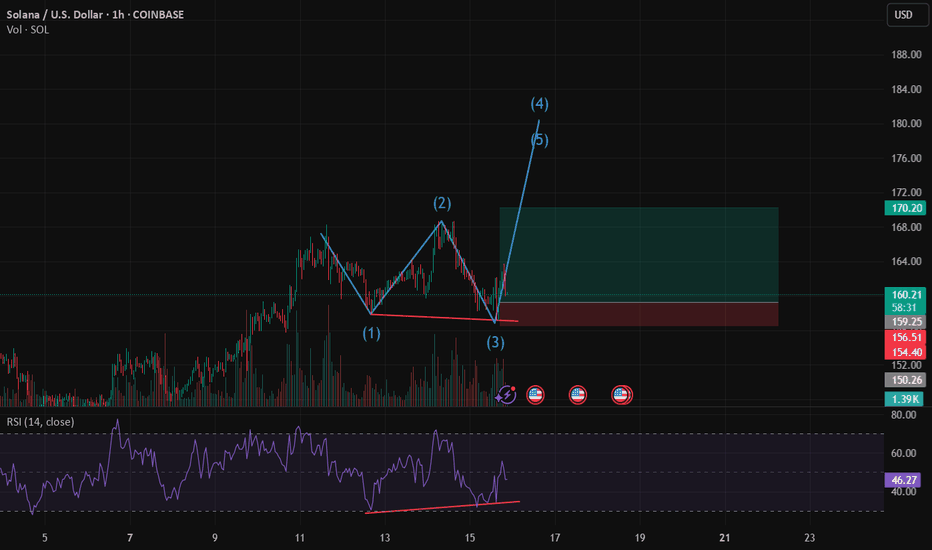
Solana seems to still have more breath to push the price up the page from this double bottom after a strong push up with good volume! It has a good chance to push the price to 180 if you have the stomach to ride it!
A short term correction on this double top as the RSI is loosing momentum, providing a regular divergency. It could be sellers taking advantaged of high price, buyers taking profit or trapped buyers from previous highs getting out.
Double bottom forming at this key area on the pair. There's a huge abnormal sell volume candle printed in April, If really there are players positioned there a hard push up could mean a short squeeze propelling the price to go up further and quicker as sellers will have to run for cover.
It seems to me we are getting in an accumulation phase on oil. Is there another war rally on the horizon or something else!? They can manipulate price but they can't manipulate volume that easily. Notice that every time price rises, volume rises with it and when price falls, volume decreases with it. My bet would be buying bellow the last lows, where a sea of stop...
Set up forming on the hourly chart on the Dow. When or if we close bellow the 15:00 bar and if we don't trade above the recent highs in the meantime, it will be our trigger for selling short. Because its a big bar I believe there will be a price engineering from the big boys, therefore I will place a sell limit order a 50% retracement in relation to the 15:00 bar...
Double bottom with RSI divergency. It looks like buyers are interested to defend this level after a long decline.
Text book double top with RSI divergency losing momentum to the upside.
We could see a potential correction as we are seeing a double top with a temporary loss of momentum to the upside according to the RSI and volume. It's a valid trade until Trump says otherwise.
A long and extended double top on this pair. Its an unusual double top figure but combining with the RSI it ticks the box.
Double top with RSI divergency. If you have the strength to ride all the way down to neck line you going to be well rewarded.
Another double top with divergency on the oscillator. The divergency didn't quite start at the overbought zone but will give it a go.
Divergency double top on the daily chart. This could play out nicely but it will take time.


