darksignal
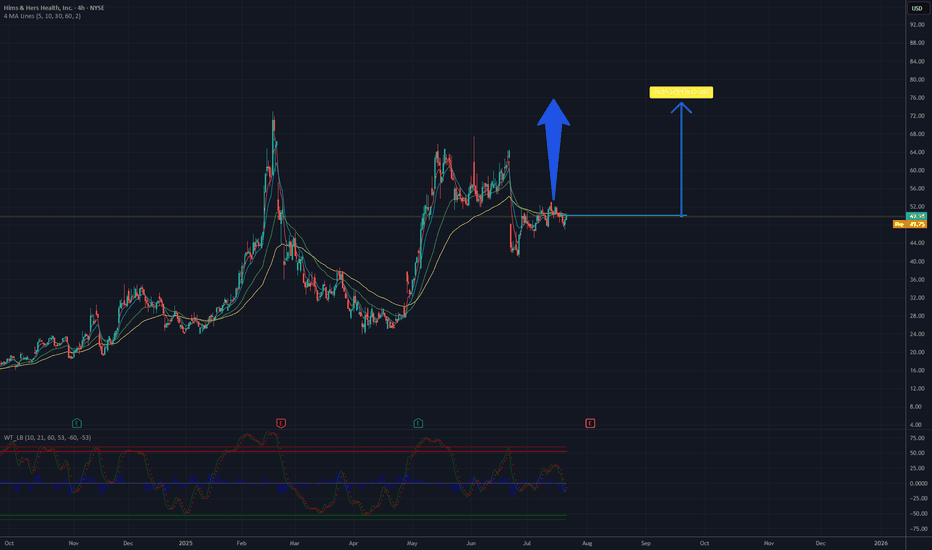
The company has announced plans to introduce comprehensive at-home lab tests, leveraging the acquisition of Trybe Labs, which could enhance service personalization and attract new customers. Additionally, expansion into markets such as Canada and Europe (through the acquisition of Zava) opens new revenue growth opportunities. The company demonstrates continuous...
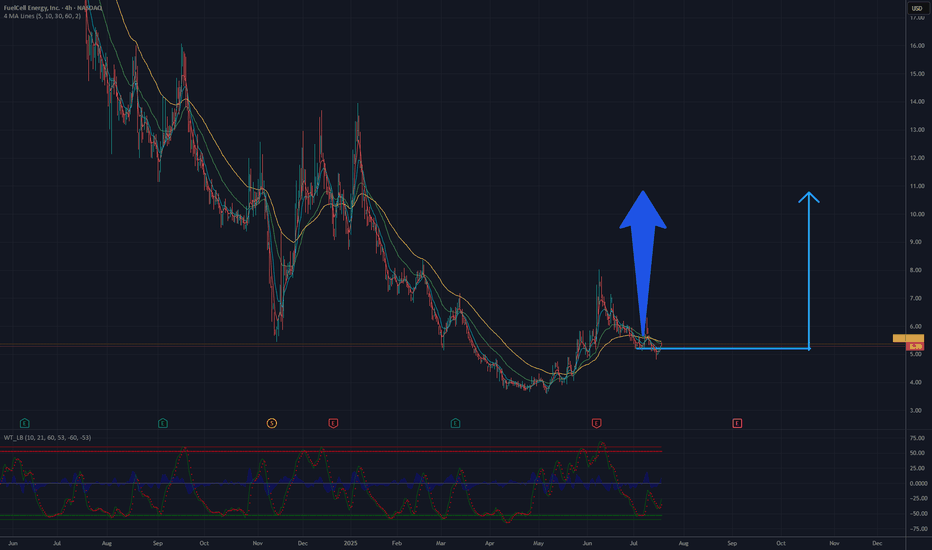
Current trend: The recent sharp price increase (around 5.25 USD) with strong volume support indicates robust demand. The upward arrow on the chart suggests a continuation of this movement. Resistance level: The nearest resistance is in the 6.50-7.00 USD range, where the price previously faced challenges. Breaking this level with high volume could pave the way to...
Two moving averages are visible (likely a short-term and a long-term one). The short-term one (yellow) crossed the long-term one (green) from below around May/June, which is typically a buy signal (golden cross). Currently, both moving averages show an upward trend, and the price is above them, confirming a positive sentiment. As of today, July 21, 2025, the...
Two moving averages are visible (likely a short-term and a long-term one). The short-term one (yellow) crossed the long-term one (green) from below around May/June, which is typically a buy signal (golden cross). Currently, both moving averages show an upward trend, and the price is above them, confirming a positive sentiment. ndicators at the Bottom of the Chart...
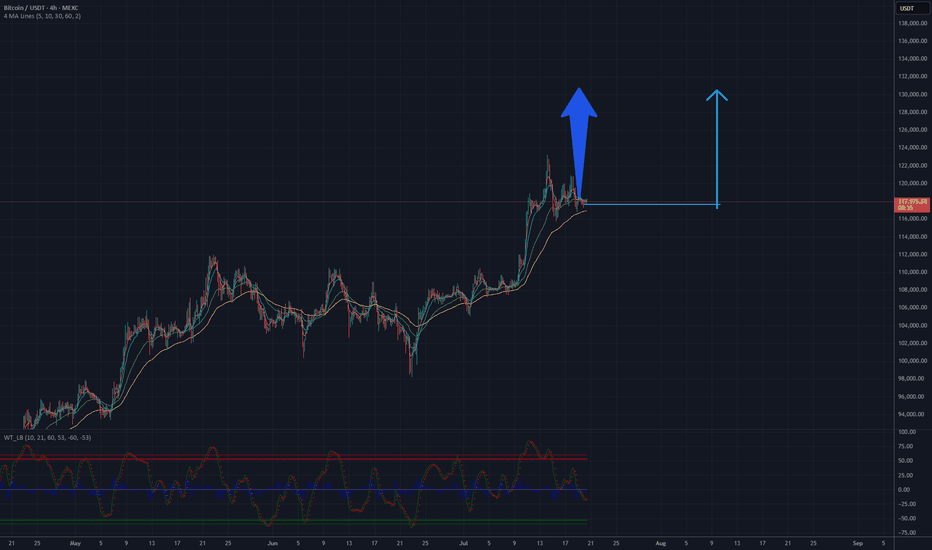
Analysis of the Bitcoin (BTC/USDT) chart on the MEXC platform indicates a positive upward trend. The price is currently hovering around $117,823, with clear support at approximately $100,000, as confirmed by the lower channel line. Moving averages (MA) suggest a sustained upward trend, and the trend line drawn from the lows points to potential for further growth....
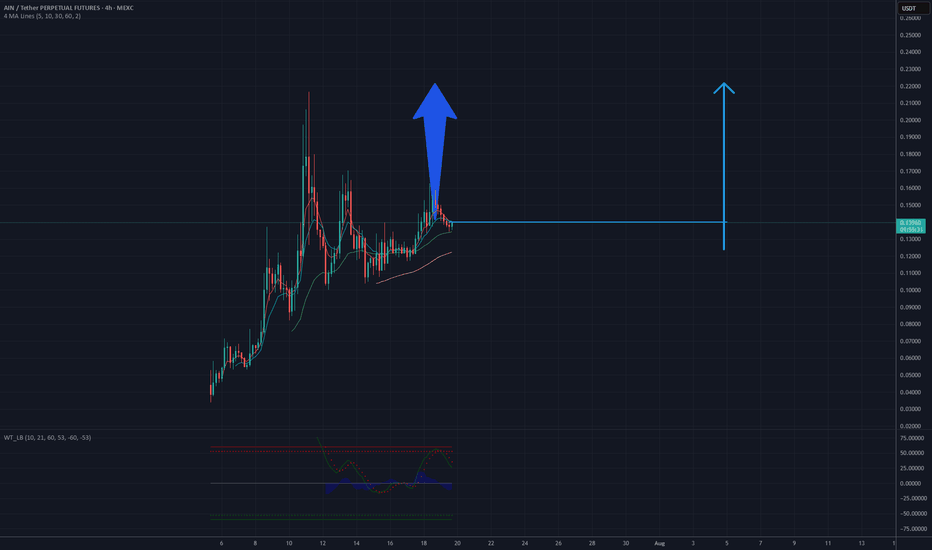
Analysis of the AINUSDT chart on a 4-hour timeframe suggests potential for an upward move. The current price is near a support level around 0.13 USD, where consolidation is observed after a previous decline. The upward price movement from the lows, supported by an ascending trendline and a break above resistance near 0.15 USD, indicates a possible continuation of...
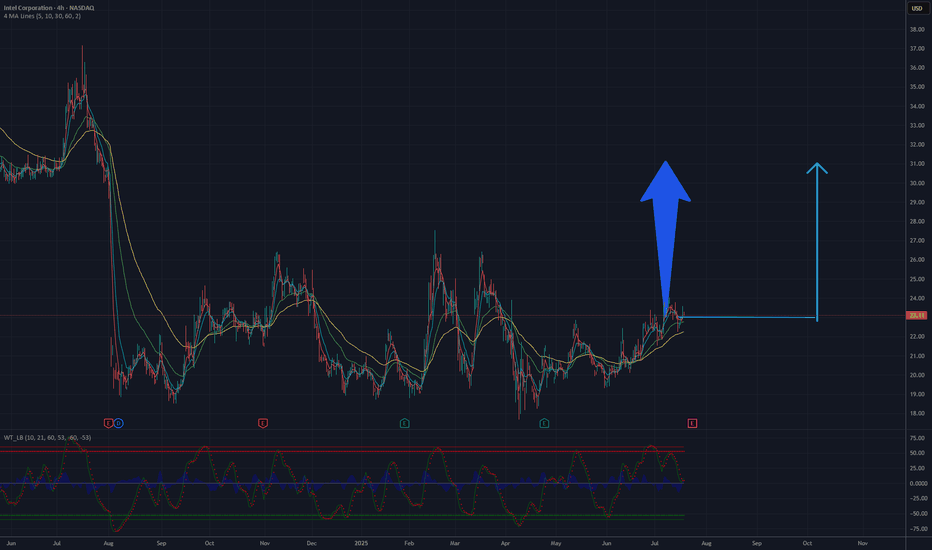
The Intel Corporation (INTC) chart on NASDAQ illustrates the stock price dynamics from 2024 to July 2025. Initially, the price rose to a peak in the first half of 2024, followed by a significant decline, reaching its lowest point around 24 USD by the end of 2024. Since then, the price has been consolidating in the 24-26 USD range, which may signal preparation for...
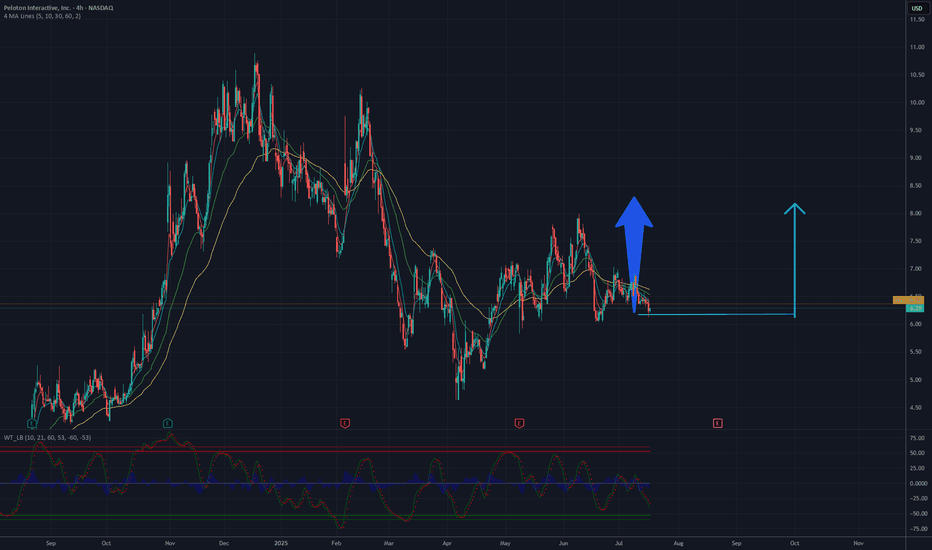
The chart analysis for Peloton Interactive, Inc. (PTON) suggests a potential rise with a target of 8.20 USD. The 4-hour chart indicates a recent downtrend from a peak around 10 USD, with the current price stabilizing near 6.30 USD. A key support level is observed around 6 USD, which could provide a strong base for an upward move. The 50-day and 200-day moving...
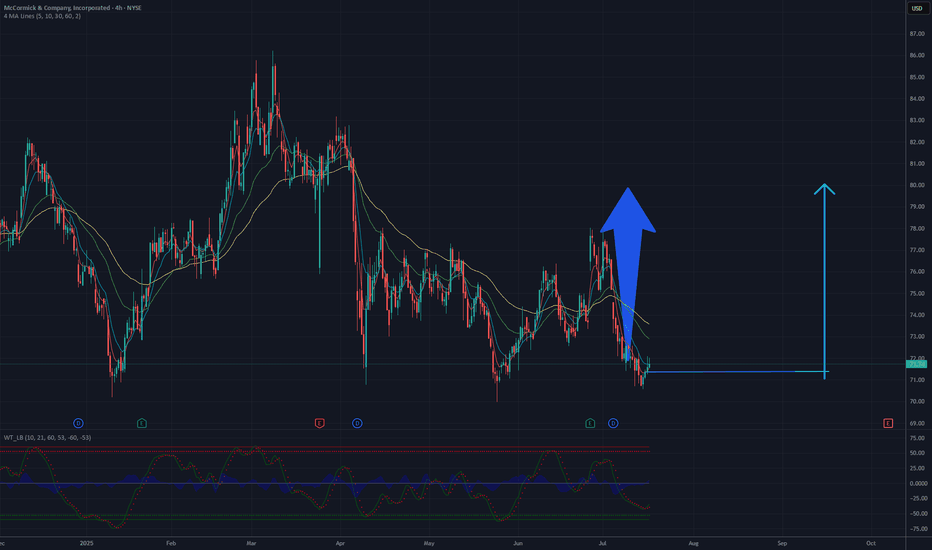
The chart analysis for this stock suggests a potential rise to 80 USD based on current technical patterns. The 4-hour chart shows a recent downtrend following a significant peak, with the price currently hovering around 71-72 USD. A key support level is evident near 70 USD, which could serve as a foundation for a potential rebound. The moving averages, including...
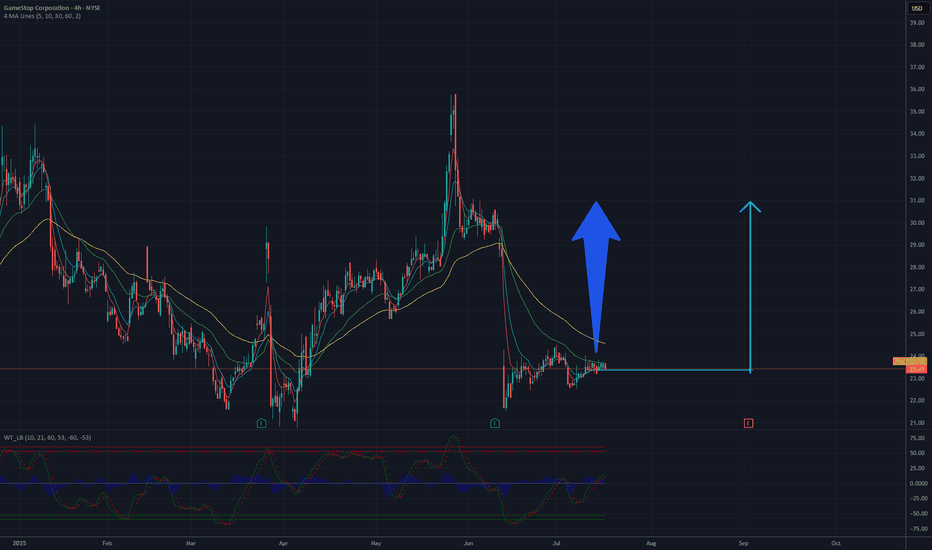
Analysis of the GameStop (GME) chart suggests a potential rise to 30 USD, based on current trends and technical levels. The 4-hour chart shows a recent decline following a sharp increase, with the price currently fluctuating around 23-24 USD. Key support is located at approximately 22 USD, which could act as a floor if the price starts to drop. The moving averages...
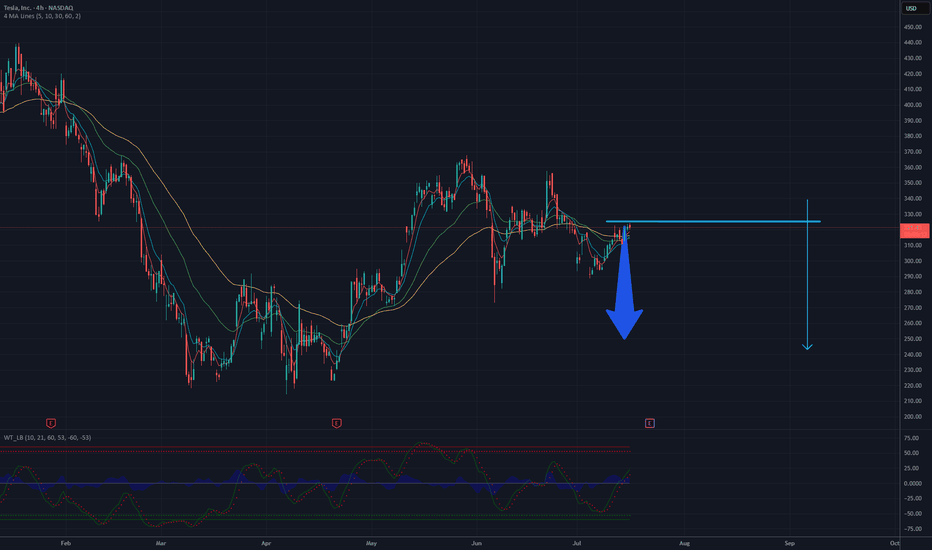
Tesla is consolidating in a tight range, showing bearish pressure near the lower boundary of the formation. Moving averages (MA 5/10/30/60) are flattening, indicating a loss of bullish momentum, while the Wavetrend oscillator has issued a sell signal (bearish crossover below the zero line). A downside breakout from this range projects a potential move toward the...
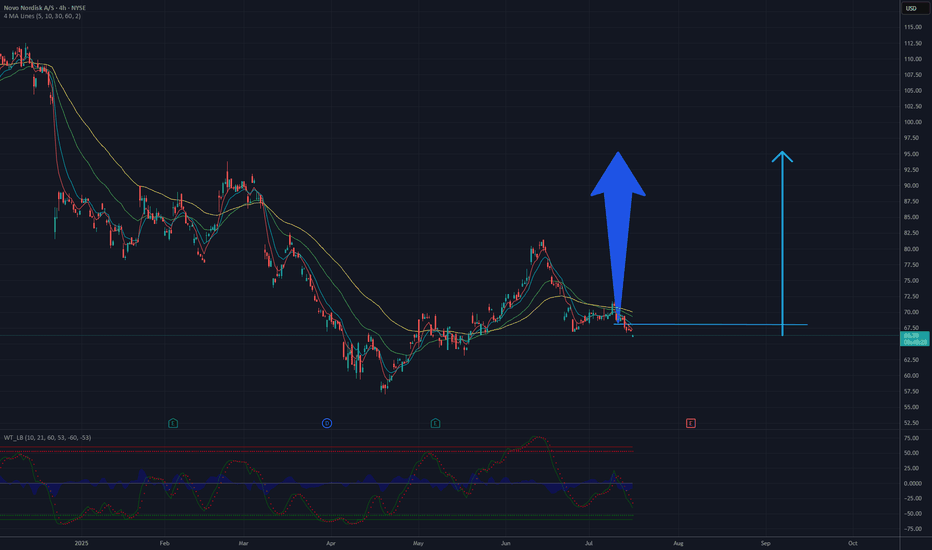
Based on the 4-hour chart of Novo Nordisk A/S (NYSE: NVO), the stock has undergone a strong downward correction from above $165, but is now showing signs of a potential technical bottom near the $65 level. Price action has stabilized, and oscillators indicate oversold conditions, suggesting a possible trend reversal. The chart shows a short-term consolidation...
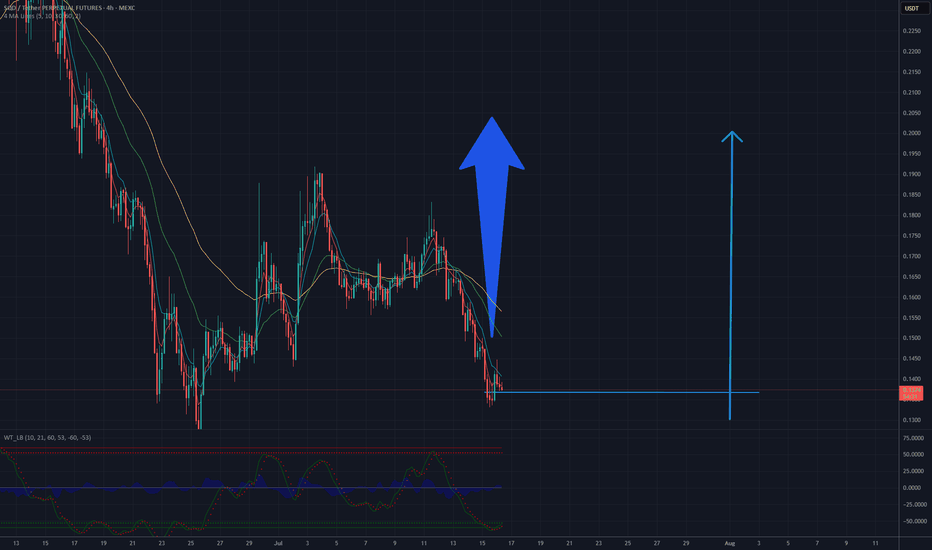
After a prolonged downtrend, SQD/USDT has reached a significant support zone between $0.13–$0.137, where a local bottom appears to be forming. The WT_LB oscillator is showing a positive divergence — price is making lower lows while the indicator is making higher lows — which often signals a potential reversal. The price is beginning to consolidate above the...
Lucid Group Inc. (LCID) on the 4-hour chart is showing a moderately bullish structure, suggesting potential for continued short-term upside. After a period of consolidation and base-building, the price has broken above key moving averages (MA5, MA10, and MA30), which are now turning upward and beginning to act as dynamic support. This shift indicates improving...
On the 4-hour chart of BMT/USDT, we can see continued consolidation following a sharp decline. The price is moving within a narrow range just below the resistance formed by the EMA lines (10, 21, 30), which currently act as dynamic barriers. A breakout above these moving averages could be the first sign of a shift in sentiment. The oscillator (WT_LB) shows an...
Oscar Health (OSCR.US) is currently trading near the technical support zone of $14–$15, a level that has historically acted as a base for rebounds. In May and June 2025, the stock saw sharp upward movements, breaking through the $20 mark, which confirms strong bullish potential. The current pullback may offer a buying opportunity before another upward leg. Once...
The current situation on the IDOL/USDT chart suggests an accumulation phase around the 0.0135–0.0137 USDT range, with clear buyer dominance in the order book. The price is holding above key moving averages, indicating potential for an upward breakout. The target set at 0.026 USDT aligns with a possible resistance zone and is a realistic objective if a strong...
The Humanity/USDT token is currently in a clear correction phase following a sharp upward move that peaked around 0.12 USD. The current price (~0.0568 USDT) is trading near the long-term MA60 line, indicating a possible accumulation zone that could serve as a base for the next upward move. Momentum indicators are deeply oversold, and volatility is decreasing,...
