fortunemakori1
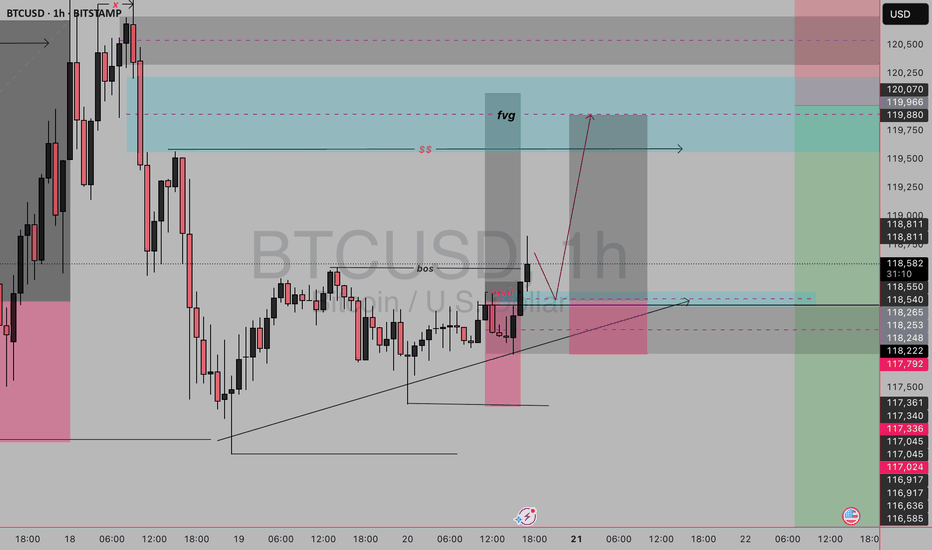
This BTC/USD 1H setup is a Smart Money Concept (SMC) long trade, built on liquidity, market structure shift, and mitigation. Let’s break it down: Setup Breakdown 1. Market Structure Previous bearish leg created a deep selloff. Price swept a low, broke above a structure (BoS = Break of Structure) → indicating possible reversal intent. 2. Liquidity Sweep See the...
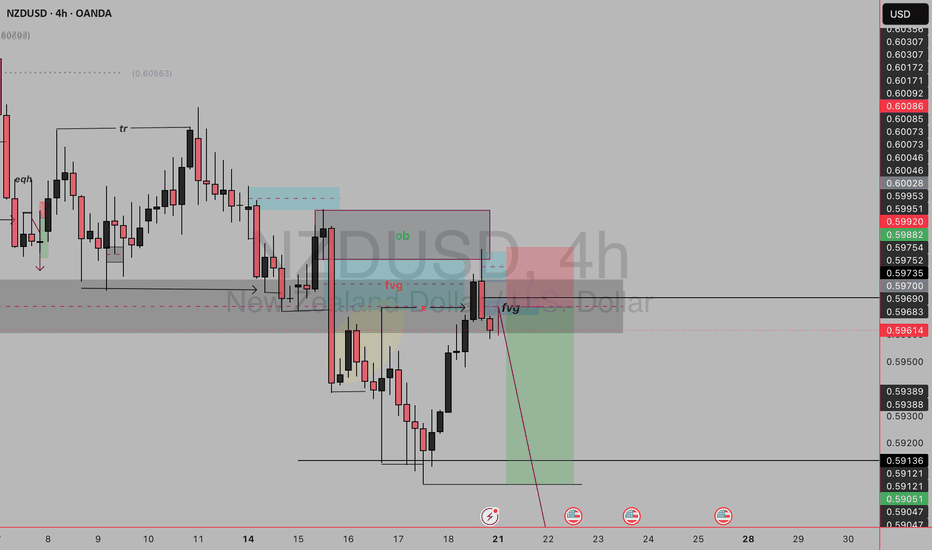
✅Market Structure: Bearish. Clear lower highs and lower lows. Price retraced into a premium zone after the last strong sell-off. ✅Key Elements in the Setup 1.OB (Order Block) – Blue zone: This is the last bullish candle before a strong bearish move. Acts as a supply zone. Price tapped into it before reacting. 2.FVG (Fair Value Gap) – Highlighted (yellow &...
Previous day high swept by day high looking to buy at discount areas near yesterday low so sell setup with stops at yesterday high which has already been swept .In lower tf as seen we are filling imbalance to continue higher while dxy also retrace previous resistance as support we would look to short to the area
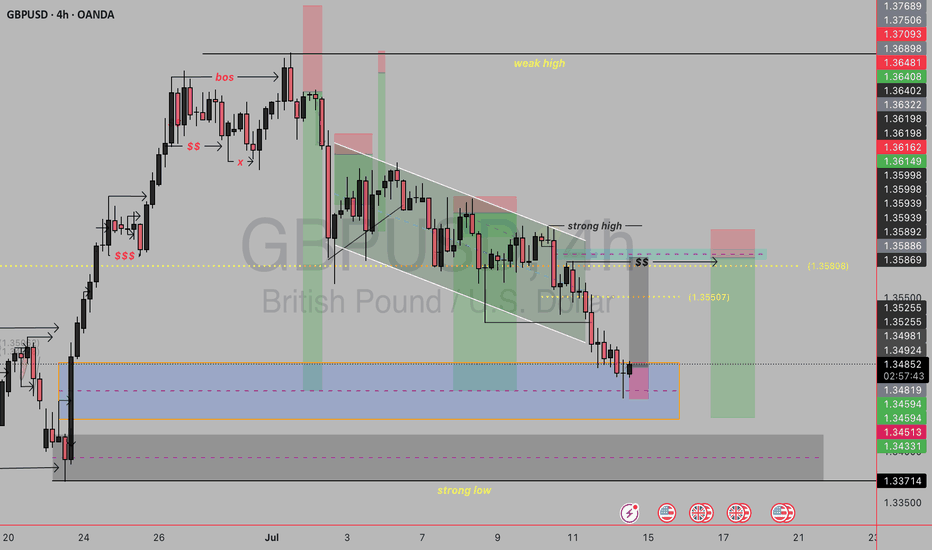
Timeframe: 4H Current Price Area: 1.3485 Price Structure: Bearish trend → possible reversal zone Tools Used: LuxAlgo SMC, Market Structure Breaks (BOS), Supply & Demand zones, Liquidity zones, and internal trendlines 🔧 Structure Breakdown 🟥 1. Break of Structure (BOS) at the top: There was a bullish BOS earlier (left side of chart), but now the structure shifted...
Setup Breakdown: 1. Previous Downtrend and Market Structure Shift (MSS): Price was in a clear downtrend, as seen on the left side. A Market Structure Shift (MSS) is marked — this suggests the beginning of a potential bullish reversal. After MSS, price makes a higher high and pulls back, indicating bullish interest. 2. Liquidity Grab Below Previous Day’s Low...
we have retested daily where we broke previous candle open and currently changed structure currently waiting for retracement to the 50% and premium zone to short
🧠 Setup Summary: You're anticipating a retracement into a supply zone (marked by the grey box) which contains a Fair Value Gap (FVG) before continuing the bearish move. 🧩 Key Components: Supply Zone (Grey Box): A previously mitigated zone where price dropped aggressively. Likely institutional sell orders remain there. Fair Value Gap (Orange Zone): Price moved...
🔍 Key Concepts in This Setup: 1. Break of Structure (BOS) – Bullish Shift The BOS shows that price has broken above a previous swing high, signaling a shift from bearish to bullish market structure. This confirms bullish intent and opens the door for pullback buys. 2. Fair Value Gap (FVG) – Blue Zone This imbalance zone is created when price aggressively moves...
Fair Value Gap (FVG) - Highlighted in Orange: This is an imbalance zone where price moved quickly without much trading. It acts as a potential supply zone where institutions may have unfilled sell orders. Your sell is anticipated after price returns to fill the FVG. Market Structure Break (BMS): Shown by the horizontal black arrow. Price broke the previous low,...
As we can see we are currently on an uptrend on higher timeframe and price is in daily fvg and has mitigated the bullish order block on daily tf on lower timeframe we have seen liquidity sweep and break of structure and clear inducement provided so we wait for price to tap the ltf orderblock and buy
Since dxy is showing some bullish momentum and was expecting a strong dollar if we close bullish on this 30 min candle we can go long ..quick newyork trades
The trend on ltf is currently bearish and i have noticed a break of low plus liquidity available to grab for sells .Since its a counter trend due to HTF trend we go low risk short if given a retracement
Sweep of liquidity above recent highs (SSL). Return to a supply zone (gray box). Fibonacci confluence around 0.618 level. Expectation: Price will reject the zone and target previous low around 0.60298. Bearish Confirmation Signals to Watch: Rejection candles (wicks) at the red zone. Bearish engulfing patterns or strong bearish candles. Momentum divergence (e.g.,...
As noted there we are in a downtrend as price is breaking lows and forming lower lows but looking at weekly we are currently bullish having a retracement meaning this is a counter trend following the retracement no high has been broken to continue the trend and i see ssl liquidity swept on ltf waiting for trans and reteracement to my liquidity area to take sells...


