jaredoced
EssentialLast seen
Followers
2Following
3Ideas
2Scripts
0Joined Jun 8, 2023
chartpattern
indicator
movingaverage
trendanalysis
Less Tags
Show All Tags
All Types
Type
All Types
Indicators
Strategies
Libraries
All Accesses
Script access
All Accesses
Open
Protected
Invite-only
Public & Private
Privacy
Public & Private
Public
Private
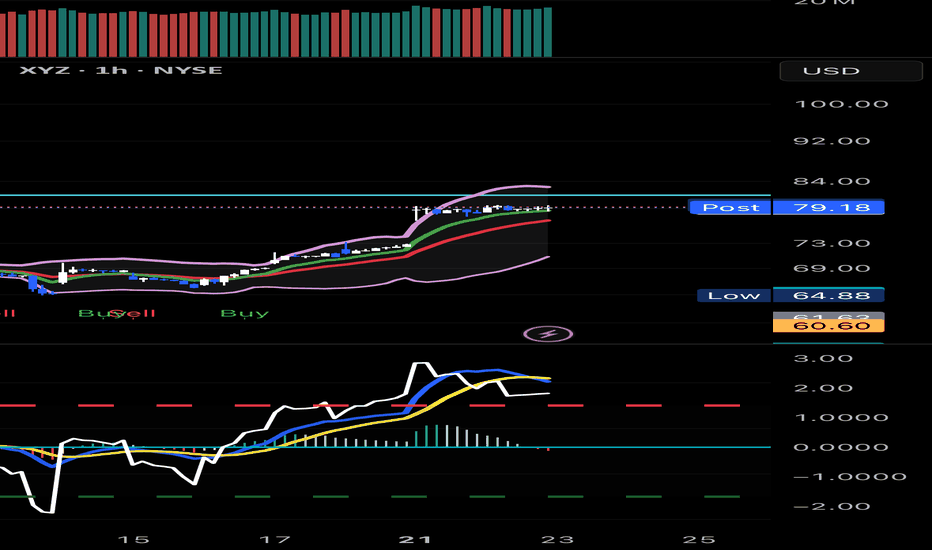
Looks like the one hour chart is respecting the small resistance area of the low $80s. RSI is well above the overbought range as well as the MACD. I still remain bullish but believe this may be a little range bound between $75 -$80 until another breakout.
1
I’m seeing in the 2 H chart a candle outside the outer upper Bollinger, a divergence in the RSI which is pinned around 70, and The MACD also showing signs of a pullback. I believe this will kiss $59 of so and bounce further to mid 60s.
3
0
0
0
Message
Follow
Following
Unfollow
8
3
7
Message
Follow
Following
Unfollow
Online
2310
903
801
Message
Follow
Following
Unfollow
19927
3917
9362
Message
Follow
Following
Unfollow
18
10
16
Message
Follow
Following
Unfollow
Type
Script access
Privacy


