marshyyy
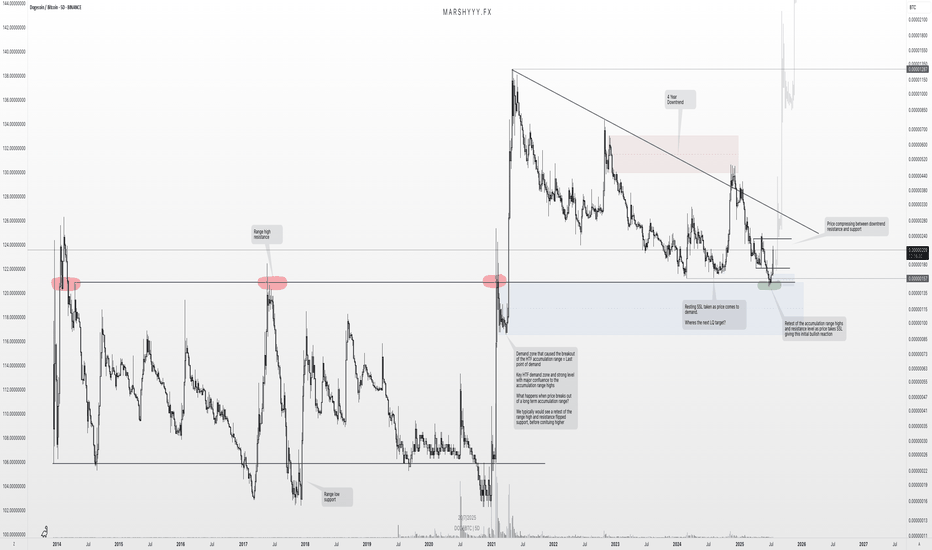
PremiumDiving into DOGE/BTC, we’re seeing strong bullish confluences that align well with the DOGE/USDT structure and support the idea that the macro low is in. Looking back across all available data, DOGE/BTC has traded within a clear 7-year accumulation range dating back to 2014, bounded by a defined range high resistance and range low support. This long period of...
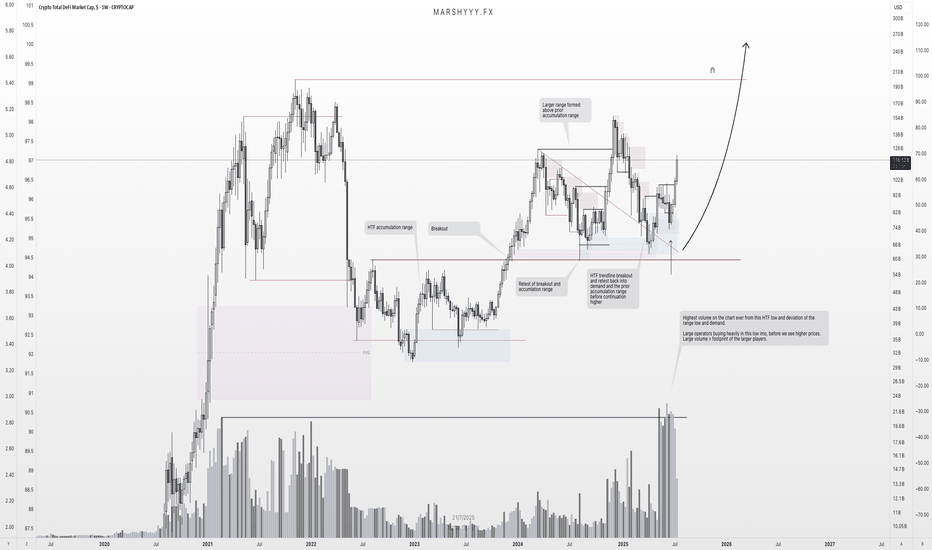
This is one of the cleanest HTF setups in the market right now — and it’s flying under the radar. We're looking at TOTAL DEFI market cap, and it’s showing all the signs of strong reaccumulation following a textbook breakout–retest structure off a larger HTF accumulation base. Price broke out from the 2023–2024 accumulation range, retested that breakout zone and...
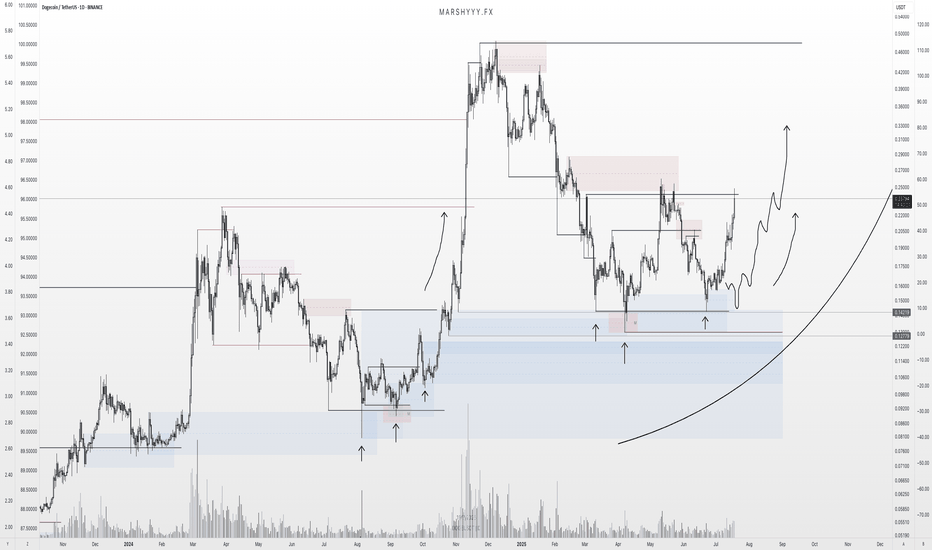
DOGE is playing out almost exactly as forecast back on June 14th, where I was monitoring for price to sweep the SSL and tap into range low demand within this larger HTF range. Price did exactly that — pushing into discount, tagging the marked demand zone, and bottoming out right where I expected the reversal. I DCA’d hard at $0.165 after the initial low printed —...
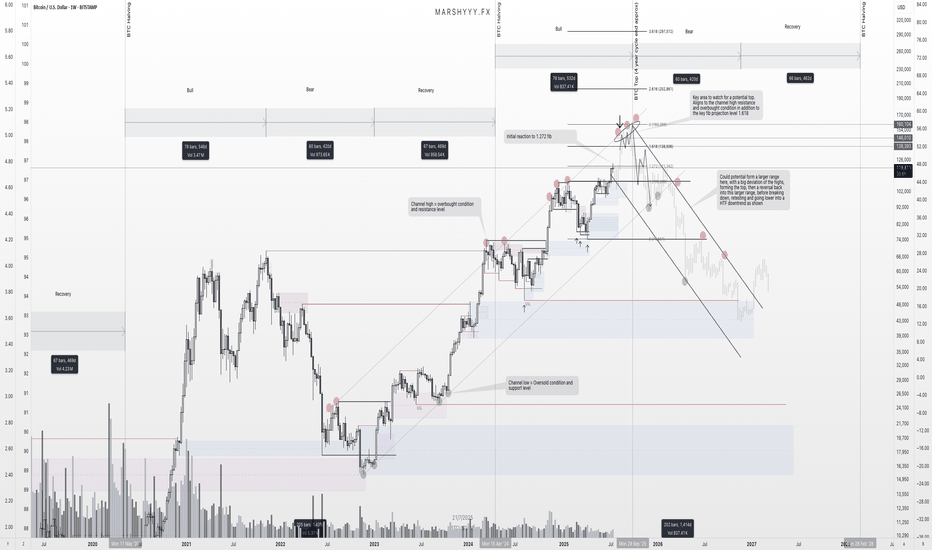
Been getting a lot of questions recently about where I think BTC tops this cycle, so I figured it’s time to lay out what I’m seeing on the higher timeframes and what could be coming next. First off, I want to stress this again — USDT.D will be the key chart for spotting the top. It’s been one of the most accurate indicators across the board for understanding tops...
FET is looking strong here from a high time frame perspective — currently sitting around $0.739, well into the discount zone of the macro trend channel. We’ve got: ✅ Price holding monthly demand ✅ A clear swing higher low forming on the weekly and 3W ✅ Already seen the first expansion leg out of demand ✅ Now potentially loading the next move higher Zooming...
Back in mid-June, I published a BTC update calling for a local correction into HTF demand while most were screaming bear market and waiting for deeper breakdowns. Price action played out exactly as forecasted. BTC swept the $100k swing low, front-ran my first demand zone by $400, and launched into a powerful reversal — just like it did back in April, where it...
Over the past couple of months, I’ve been tracking the development of a potential high time frame (HTF) Wyckoff distribution range forming on BTC Dominance (BTC.D), and it’s now looking like that structure is starting to break down. Back on June 14th, I noted that while we hadn’t confirmed a trend shift yet, BTC.D was showing strength and likely to push into the...
This chart visualises a powerful relationship — stablecoin dominance (USDT.D + USDC.D) versus OTHERS dominance (i.e. altcoins excluding BTC and ETH). Put simply: When this chart moves down, stablecoins are flowing into altcoins — risk-on behavior, altseason ignites. When it moves up, capital rotates back into stables — risk-off behavior, weakness across...
This chart might not get as much attention as BTC dominance or TOTAL, but Bitcoin volatility (BVOL) is one of the cleanest leading indicators when it comes to identifying market tops and bottoms. Just look at the history — every major macro top or bottom in BTC price has correlated with a peak or trough in this chart. Whether it was the ATH in March 2024, the...
Initially in my last update, I was expecting USDT.D to push into daily supply levels after taking the swing low from the prior daily higher low — pulling back into supply before continuing lower after the market structure break. Instead, it pushed even deeper, taking out the range low swing at 4.56%, which allowed BTC to break higher and tag its ATH by taking...
BTC Update Well due update here... Since my last forecast, price pushed higher without giving the pullback I was anticipating — instead sweeping liquidity above the prior ATH. After taking that BSL, price stalled and has since been ranging, showing clear signs of bearish momentum creeping in. We're seeing bearish orderflow on the LTF and daily, and volume is...
Bitcoin 4-Year Cycle Structure – Technical Breakdown This chart examines Bitcoin’s historical 4-year cycle behaviour, focusing on the repeating market structure observed across the last three cycles: Bull Market → Bear Market → Accumulation/Recovery → Halving → Expansion. Key Observations: 🔹 Cycle Timing Consistency Each of the past three cycles has shown a...
Im monitoring for something like this on DOGE with the plan to DCA as it takes SSL and comes into the range low and demand. Looking a little weak here with signs on majors of weakness, i can see this going into the SSL and lower demand areas marked. Still seeing this as a large range development and looking for a HTF bullish reversal to form in this...
Price rejected from the 3M HTF supply and major BSL on the prior highs. Price has now gave a confirmed 1W bearish market shift, indicating a market wide altcoin reversal is playing out and the next bullish impulse higher isnt far off.... Watching for rejections in this weekly supply on this pair as marked and looking for a bearish daily market shift to give...
An interesting chart with BSL still to take and pushing for it. If you study the time cycle of last cycles altcoin season you will see that it occurred after this chart took the range highs and BSL and then distributed from there to new lows I believe we are seeing the same scenario setting up in this chart and data with it pushing to the BSL and range highs...
Just toying with ideas of what may be developing here so dont take the chart as what i think will happen perfectly as shown. With the strength seen from BTC.D atm, it looks more and more likely it may go for the highs again and into the higher levels above 65%. I still see this as a very large range from the february high and lows that got put in and the prior...
USDT.D Update: Its been a while since my last USDT.D update on here since i accurately forecasted and called the top in September last year from its last distribution range. Since then, Ive been expecting USDT.D and USDC.D to continue higher into deeper premiums and into monthly and 3M supply areas, taking further BSL in the process and coming into the HTF...
Morning all! So its time for a proper set of markups having spent the last few months breaking down the charts in video format for you all. The last BTC update I gave was on 24/03, in the 4 year cycle analysis breakdown. In that video i was expecting lower pricing into SSL and the range lows once more, forming a bottoming structure before seeing a HTF bullish...


