mrsameofficial
Jindal Stainless Ltd has been forming higher lows and has now broken through the key resistance level at 660. With this congestion breakout, the stock signals a continued bullish move, potentially heading towards the target of 740. Please conduct your own technical analysis and apply proper risk management before taking any trade. This is solely my personal view....
📊 Stock Analysis: MCLOUD The stock has been consolidating within a ascending triangle pattern and is nearing a critical Buy Above level at ₹80 , signaling a potential breakout. The target is set at ₹179, offering a potential gain of 123.75%. Key insights: Trend: A breakout above the wedge could indicate renewed bullish momentum. Support Levels: Strong support...
#AMARAJARAJA, #EnergyStocks, #Bullish, #BreakoutRetest, #TechnicalAnalysis, #NSE ARE&M Amara Raja Energy & Mobility Ltd (AMARAJARAJA) is currently retesting a key Support zone around ₹950, After a solid upward move, the price is pulling back in a healthy manner, forming a textbook bullish retest pattern. This setup often precedes a continuation of the...
📊 Stock Analysis: MOSCHIP The stock has been consolidating within a ascending triangle pattern and is nearing a critical Buy Above level at ₹187 , signaling a potential breakout. The target is set at ₹359, offering a potential gain of 25.90%. Key insights: Trend: A breakout above the wedge could indicate renewed bullish momentum. Support Levels: Strong support...
Bajaj Hindustan (Ethanol/Sugar Company) if it sustain above 23 then I'm bullish in this for 1000% gain. It'll going to give 13 years breakout. Keep an eye on this. NOTE: We are not SEBI registered. It's for knowledge purpose only. Consult to your financial adviser before take any trade. MAY 27 , 2024 Note entry trigged add half and more on weekly candle close above 23
Keep eye on TATATECH. If the price moves above 732, consider buying with a small SL. Confirmation of the head and shoulders pattern occurs when the price breaks decisively below the neckline Disclaimer: This is not financial advice. Please do your own research or consult with a financial advisor before making any investment decisions. Investments in stocks can...
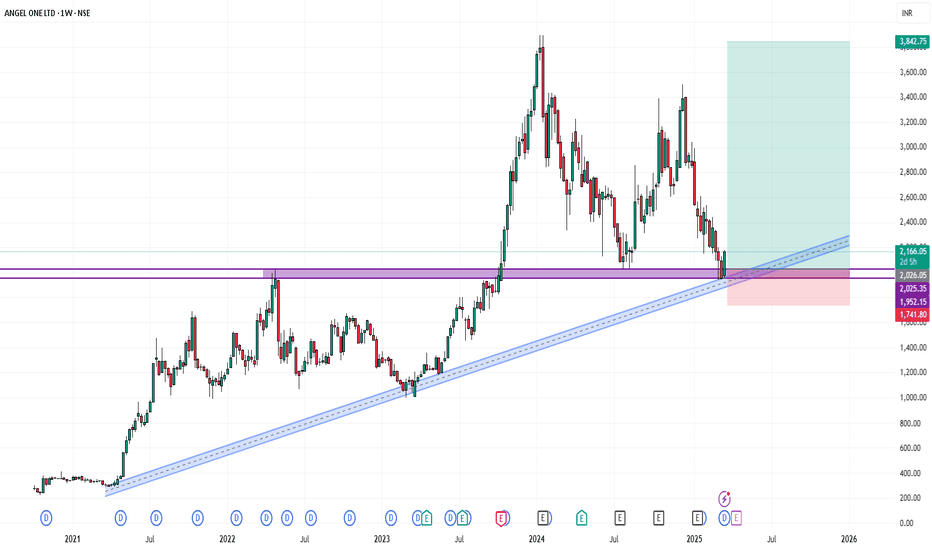
ANGELONE 's stock price has been retesting around the 2000 resistance level for approximately two and half years. Following multiple retest, the stock finally broke out above this level in October 2023 and has since established it as a key support. The stock subsequently surged to a peak of 3895, representing a 87% increase. However, it then experienced a sharp...
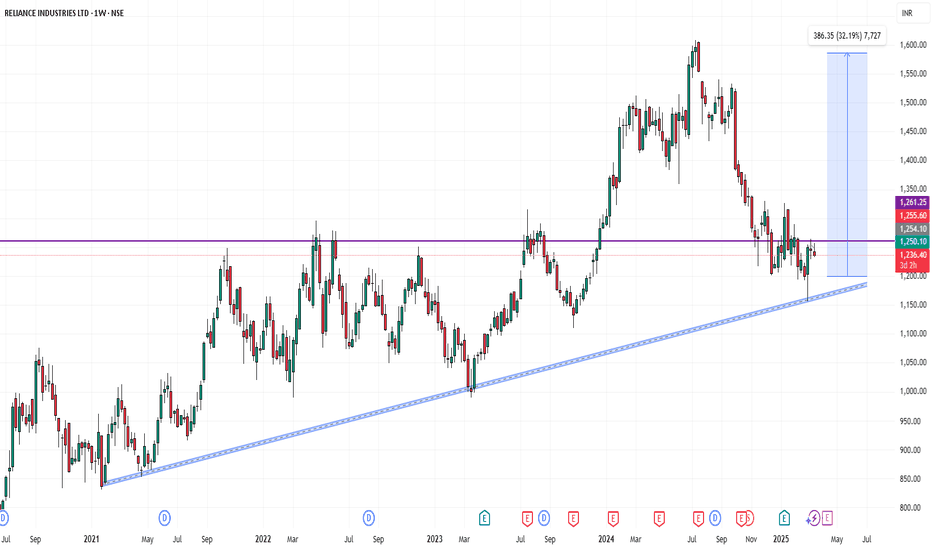
📈 Reliance Industries Breakout Alert – ₹1241 Key Level Breached 🚀 Reliance Industries has successfully broken out above a strong resistance zone near ₹1241, indicating a potential bullish move ahead. This level acted as a critical supply zone in the past, and the breakout with volume confirmation adds strength to the trend. 🔍 Technical Highlights: Breakout...
📊 Price Action & Trend Analysis Analyzing market trends using price action, key support/resistance levels, and candlestick patterns to identify high-probability trade setups. Always follow the trend and manage risk wisely! Price Action Analysis Interprets Market Movements Using Patterns And Trends On Price Charts.
- The chart is self-explanatory as always. - JIOFIN is reaching its ATL. - The stock is down 40% since it started its downward trajectory. - JIOFIN is to be added to Nifty50 by March end -The company reported a slight 0.32% increase in consolidated net profit for Q3 FY25, with earnings of Rs 294.78 crore compared to Rs 293.82 crore in the same period last year....
Support is a price point below the current market price that indicate buying interest. Resistance is a price point above the current market price that indicate selling interest.
The 50-day exponential moving average (EMA) offers the most popular variation, responding to price movement more quickly than its simple minded cousin. This extra speed in signal production defines a clear advantage over the slower version, making it a superior choice
'Support' and 'resistance' are terms for two respective levels on a price chart that appear to limit the market's range of movement
Fibonacci Trend Line Strategy uses Fibonacci Retracement and Trend Lines to find profit zones. Become a Fibonacci expert!
Support/Resistance Level - Traders often perceive the 200-day moving average level as a strong support or resistance level. These levels can indicate the right time and opportunity to buy or sell an investment. For example, traders can explore selling opportunities as the 200-day moving average line is breached
A trendline is a line drawn over pivot highs or under pivot lows to show the prevailing direction of price. Trendlines are a visual representation of support and resistance in any time frame. They show direction and speed of price, and also describe patterns during periods of price contraction
The sideways market occurs when the price of a stock or security stays within a given range (between the support and resistance) for a long period of time, arriving at somewhat of a horizontal line on the graph if you were to, for example, chart a 200 day moving average for instance
A trendline is a line drawn over pivot highs or under pivot lows to show the prevailing direction of price. Trendlines are a visual representation of support and resistance in any time frame. They show direction and speed of price, and also describe


