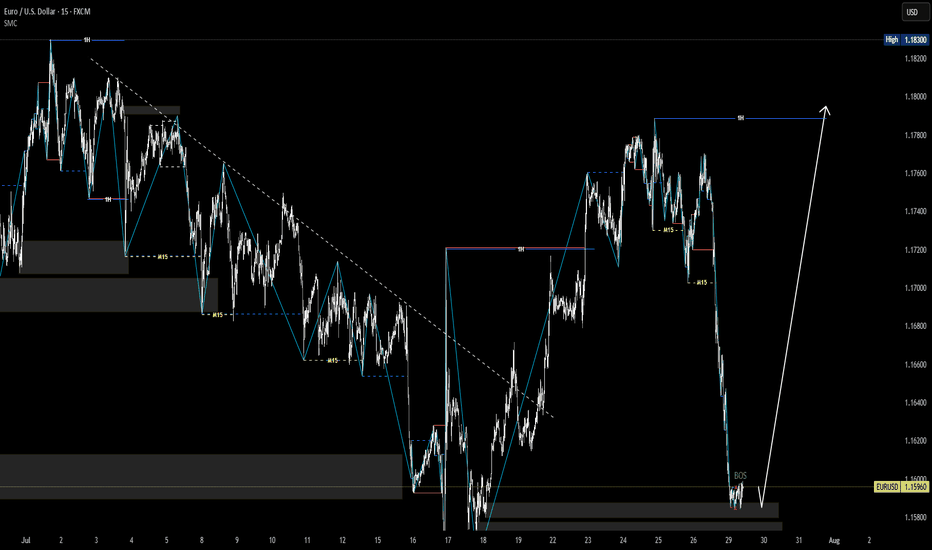
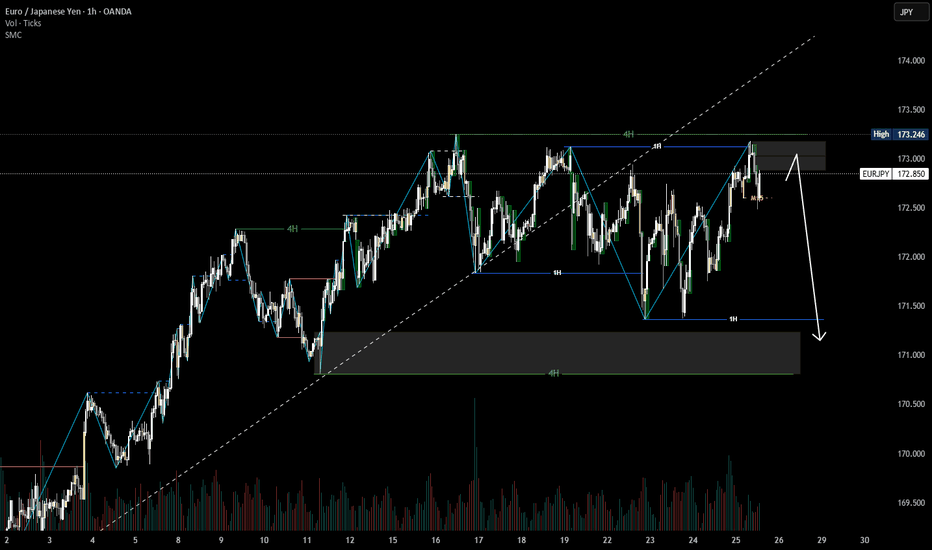
Multi-Timeframe Context (HTF: 4H, LTF: M15) The main trend on the 4H chart is bearish. Price is currently in a retracement phase (pullback). On the M15, price is in a bullish short-term structure. We monitor the M15 market structure closely to look for signs of weakness and identify high-probability short entries in alignment with the 4H downtrend.
H1 Timeframe – Main Trend: BULLISH 🟢 Current Situation: The H1 structure is showing a clear sequence of Higher Highs (HH) and Higher Lows (HL) ⇒ indicating an uptrend. The market is currently in a retracement phase following the last bullish impulse. Price is approaching a demand zone from a previous structure, where buy orders may be stacked. 📉 M15 Timeframe –...
4H timeframe is bullish. 1H timeframe is bearish Price is currently clearing the top of 1H timeframe so there is a high chance that price will continue to fall to the Demand zone of 4H timeframe.
- Week is swing bullish => current is pullback. - Day is swing bullish => current is pullback. - We can look for buying opportunities when there is a reversal signal on the 4-hour time frame or the price reaches the demand zone of the daily frame.
- Daily time frame, after price gave stop hunting signal, price increased again. - On the 4-hour time frame, the price broke through the strong peak and gave a bullish reversal signal. - So there is a high possibility that BTC will continue to rise and break the previous top.
- 4H swing is bullish, currently is pullback - 1H, M15 swing is bearish, current is pullback. - We can look for selling opportunities according to the wave configuration of H1 and M15 timeframes
- 4H swing is bearish => currently giving a top sweep signal. - H1 swing is bearish - M15 swing is bearish - We can look for selling opportunities according to the down structure of the M15 timeframe
4H swing is bearish => current is pullback M15 swing is bullish We can look for short selling opportunities if the bottom of M15 is broken
4H, Day is swing is bearish => Current is pullback M15 swing is bullish. We can look for selling opportunities if the wave structure of the M15 timeframe turns bearish.
1H, 4H swing is bullish => Current is pullback M15 swing is bearish. We can look for buying opportunities when the wave structure on the M15 timeframe turns bullish.
DAY Swing is bullish 4H swing is bearish => Current is pullback There is a high probability that the price will continue to fall We can look for a selling opportunity if on the 1H timeframe, M15 turns bearish
4H swing is bullish => current is pullback M15 swing is bearish. Currently giving CHoCH reversal signal. We can look for buying opportunities in this area. More carefully, we wait for the price to break the top to confirm the 15-minute reversal frame.
4h, 2h swing is bearish => current is pullback. M15 swing is bullish. We can look for selling opportunities according to the bearish structure of the 4H time frame. Or we can wait for the M15 time frame to show a bearish reversal signal.
4H, 1H swing is bullish. 30M swing is bearish, current is pullback. The current price is in the supply zone of the 30-minute time frame. We can look for selling opportunities in this zone.
1H swing is bearish M15 swing is bullish. The current price is in the demand zone on the daily timeframe, so there is a high probability that the price will rise again according to the wave structure on the 15-minute timeframe.
1H swing is bullish. M15 swing is bearish => current is pullback. we can look for selling opportunities in this area according to the bearish structure of M15 time frame
- 2H swing is bearish => Current is pullback - M5, M15 is bullish - We can look for an opportunity to sell down to this area if the 5-minute time frame turns bearish
Day swing is bullish => currently is pullback. Internal structure of daily time frame gives bullish reversal signal. We can look for investment opportunities in this same bridge


