shoonya0000
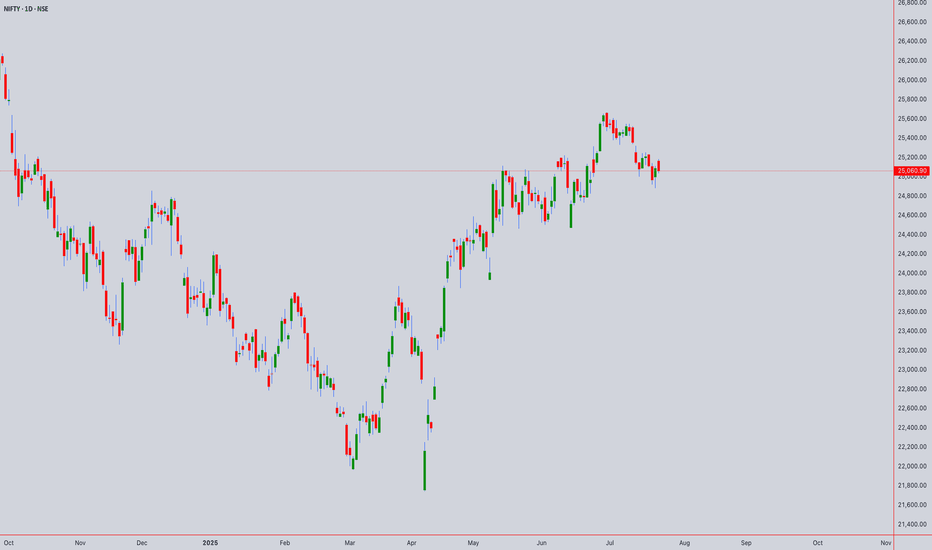
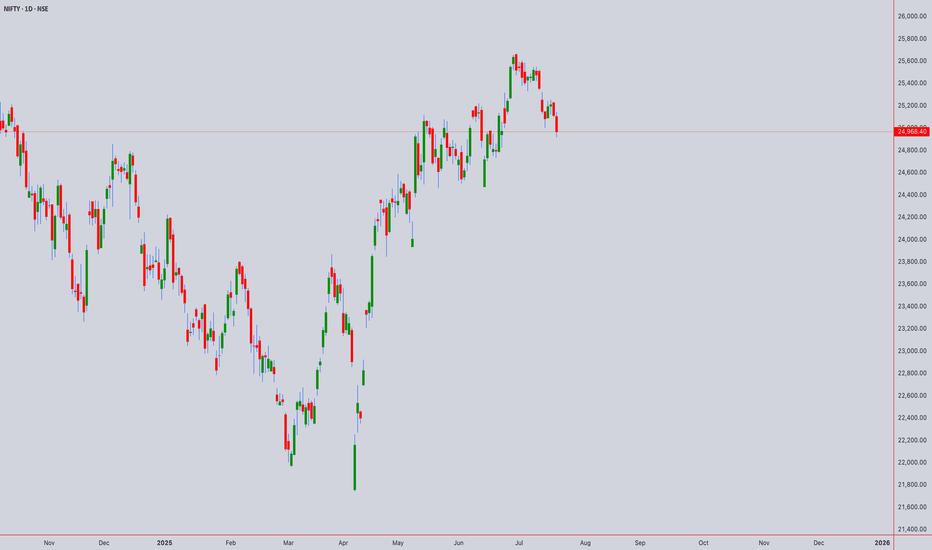
PremiumComprehensive Technical Analysis for NIFTY50 world wide web shunya trade Closing Price: ₹24,722.75 (4th Aug 2025, 02:00PM UTC+4) Time Frames: Intraday: 5M, 15M, 30M, 1H, 4H Swing: 4H, Daily, Weekly, Monthly 1. Japanese Candlestick Analysis Intraday (5M-4H) 4H: Bearish Engulfing at 24,722.75 signals rejection of highs. 1H: Dark Cloud Cover below 24,750...
Open Price: 23242.3 (UTC+4) 1. Japanese Candlestick Analysis 4H/1H: Price opened at 23242.3 near resistance (23250–23300). Recent candles show bearish harami (4H) and dark cloud cover (1H), signaling rejection. 30M/15M: Gravestone doji at 23242.3 and three black crows indicate strong bearish momentum. 5M: Shooting star formation suggests exhaustion. Failure...
1. Japanese Candlestick Analysis 4H/1H: Price opened at 147.056 near resistance (147.00–147.20). Recent candles show bearish engulfing (4H) and dark cloud cover (1H), signaling rejection. 30M/15M: Shooting star at 147.056 and bearish harami indicate exhaustion. Failure to close above 147.20 confirms weakness. 5M: Three black crows pattern emerging, suggesting...
1. Japanese Candlestick Analysis 4H/1H: Price opened at 3374.13 near critical resistance (3375–3380). Recent candles show bearish harami and dark cloud cover, signaling rejection. 30M/15M: Gravestone doji at 3374.13 indicates bearish pressure. Failure to close above 3375 confirms weakness. 5M: Three black crows pattern emerging, suggesting strong short-term...
Open Price: 3365 (UTC+4) 1. Candlestick Analysis 4H/1H: Current price (3365) near resistance zone (3370–3380). Recent candles show shooting stars and bearish engulfing patterns, indicating exhaustion. 30M/15M: Doji formations at 3365 suggest indecision. A close below 3360 would confirm bearish momentum. 5M: Short-term hammer candles at 3355–3360 hint at minor...
Long-Term (Monthly/Weekly) - SWING PERSPECTIVE Trend & Structure: Elliott Wave: Primary Trend: Bullish (Wave 3 or 5 ongoing since 2023). Current Phase: Likely final sub-wave (Wave 5) targeting ₹25,800–26,200. Risk: Completion of Wave 5 may trigger a 10–15% correction (ABC pattern) toward ₹22,500–23,000 (38.2% Fib retracement). Wyckoff &...
*Analysis as of 21-Jul-2025 (Monday)* 1. Candlestick Patterns Daily: A bearish engulfing pattern formed on 18-Jul-2025, closing below the prior candle’s low. Signals short-term reversal risk. Weekly: Doji formation (indecision) near all-time highs. Weekly close below ₹25,000 warns of exhaustion. Intraday (4H): Bearish pin bars at ₹25,100 resistance....
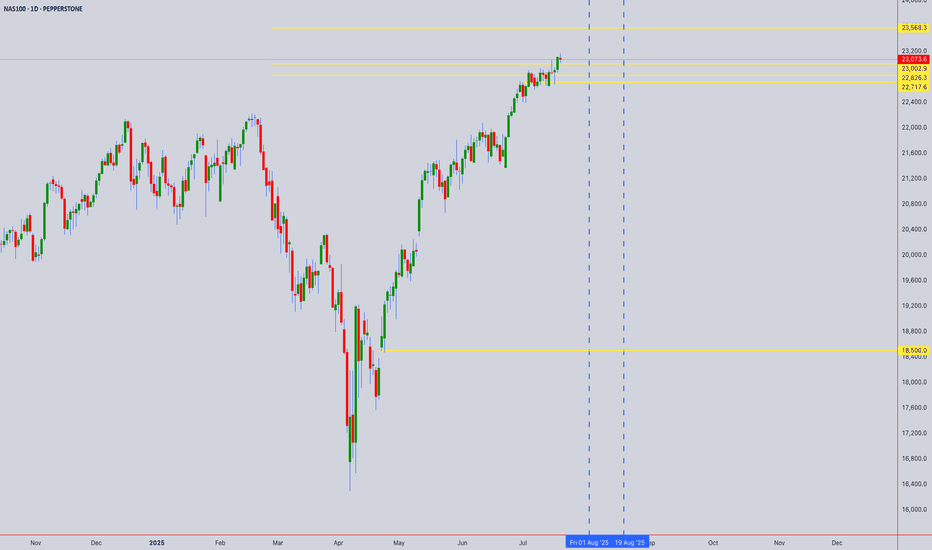
Current Price: 23,076.60 (Close: Friday, July 18th, 2025) Analysis Period: Next 24 Hours (July 19-20, 2025) Market Status: Weekend - Preparing for Monday Open --------------------------------------------------------------------------------------------- EXECUTIVE SUMMARY - 24H OUTLOOK Primary Bias: Neutral to Bullish (Short-term consolidation expected) Key...
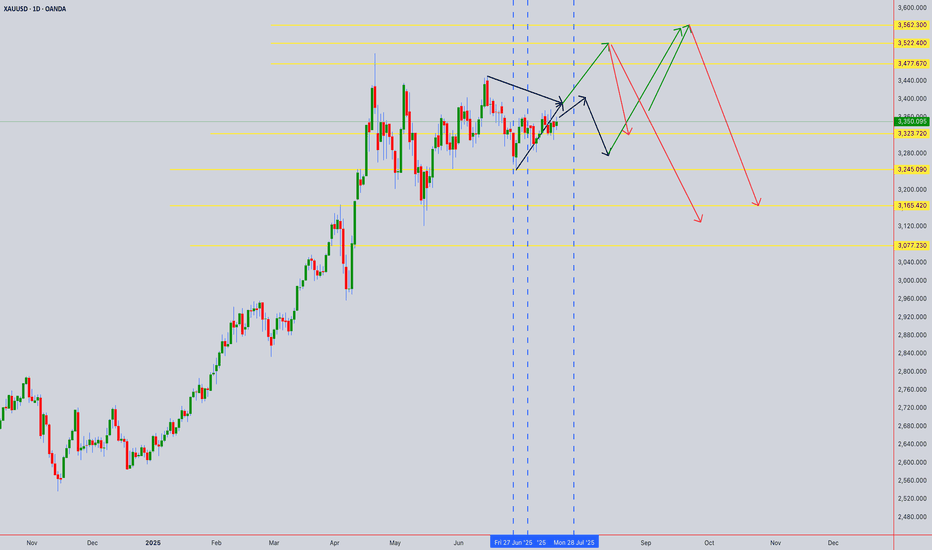
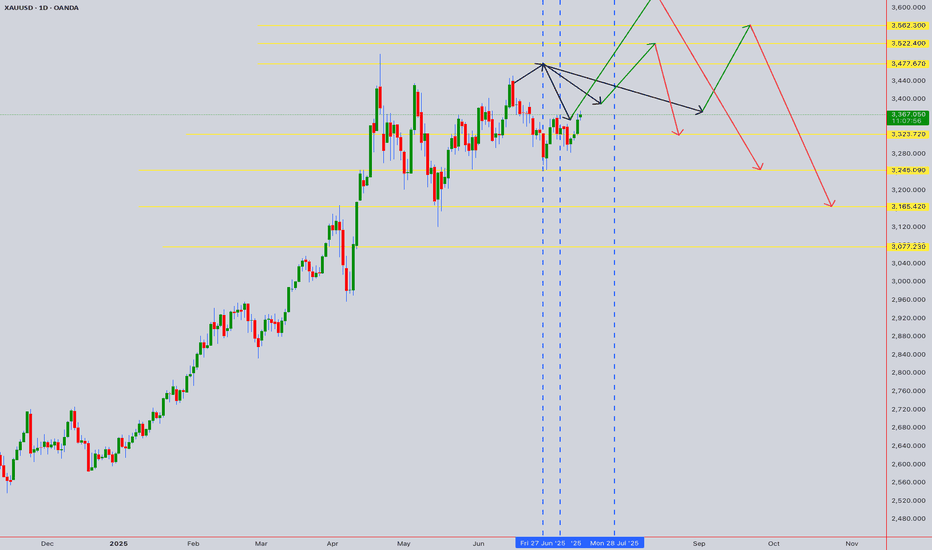
Current Price: $3,350.095 (Close: Friday, July 18th, 2025) UTC+4 Analysis Period : Next 24 Hours (July 21-22, 2025) UTC+4 Market Status: Weekend - Preparing for Monday Open 02:00AM 21st July 2025 EXECUTIVE SUMMARY - 24H OUTLOOK Primary Bias: Neutral to Bearish (Short-term) Key Resistance: $3,375 - $3,390 Critical Support: $3,285 - $3,300 Expected...
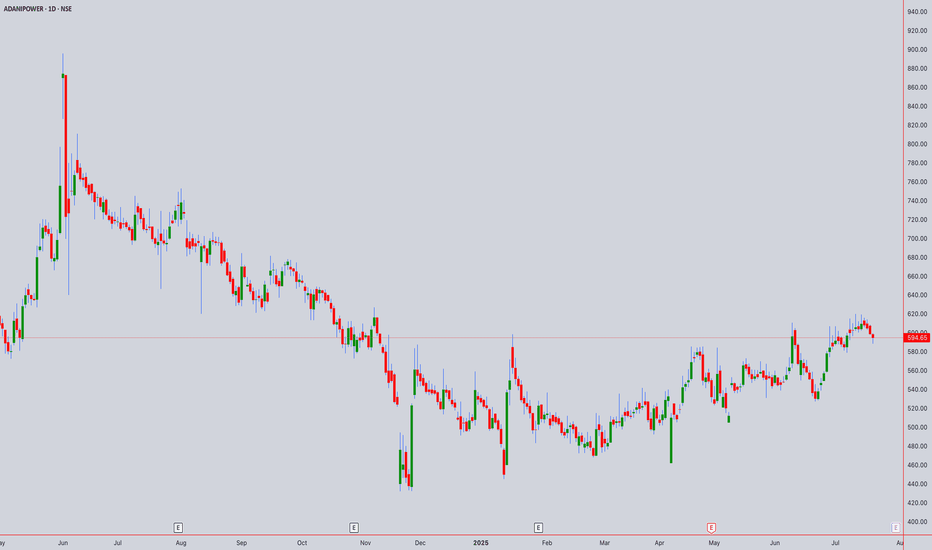
Current Price : ₹594.65 (as of July 18th, 2025, 02:00PM UTC+4) Target Price: ₹633.67 (+6.56% upside potential) Executive Summary Adani Power is currently showing mixed signals across different timeframes. The stock has broken through key resistance levels but is facing overhead resistance. Multiple technical theories suggest a consolidation phase with...
1. Candlestick Patterns Recent Structure: If NIFTY50 closed near 25,191 with a long upper wick (shooting star/gravestone doji), it signals rejection at higher levels → bearish reversal potential. A bullish engulfing/marubozu candle would indicate strength → upside continuation. Key Observation: Watch for confirmation candles. A close below 25,000 invalidates...
As of Tuesday, July 15, 2025, 2:03:11 AM UTC+4 the forecast for US100 (Nasdaq 100) in the next 24 hours presents a mixed outlook, with underlying bullish sentiment but caution due to ongoing market dynamics and potential for short-term pullbacks. Factors Contributing to a Bullish Bias: Underlying Strength and Breakout Behavior: Despite some short-term...
Based on the latest available information for July 15, 2025, the overall sentiment for XAUUSD (Gold) in the next 24 hours leans towards a bullish outlook, though with potential for short-term fluctuations and pullbacks. Key Drivers for Bullish Outlook: Escalating Trade Tensions: US President Donald Trump's ongoing tariff and trade policies are a significant...
In continuation :- The future outlook for Gold (XAUUSD) is a complex interplay of various macroeconomic factors, geopolitical developments, and market sentiment. As of mid-July 2025, several key themes are likely to shape its trajectory: Monetary Policy and Interest Rate Expectations (Central Bank Actions): Impact: Gold is a non-yielding asset. Therefore,...
The US100, which is heavily concentrated in technology and growth companies, has been a significant driver of overall market performance in recent times. Its future trajectory is intricately linked to a combination of macroeconomic trends, corporate earnings, and evolving technological narratives. Key Factors Shaping the Outlook: Monetary Policy and Inflation...
High-Level Strategy (Monthly/Weekly/Daily Recap) Overall Market Condition: The primary trend has shifted from Bullish to Bearish/Corrective due to the Monthly Bearish Engulfing and Weekly Three Black Crows patterns. Immediate Tactical Bias: The Daily Bullish Harami pattern strongly indicates a pause in the downtrend and the high probability of a short-term...
Here is my comprehensive, multi-timeframe analysis for XAUUSD. Master Analysis Report: XAUUSD This report synthesizes Candlestick patterns, Ichimoku, Heikin Ashi, Fibonacci ratios, and the outputs of our custom application to build a coherent outlook for Gold. 1. Monthly Timeframe (The Secular Trend) Observation: The monthly chart shows a powerful and...
Comprehensive Market Analysis: NAS100 1. Monthly Timeframe (The Long-Term "Big Picture") Observation: The chart displays an incredibly powerful and long-standing uptrend. The price is consistently making higher highs and higher lows. Candlestick Analysis: The most recent candles are strong, long-bodied bullish (green) candles. There are no significant...


