signetron
Premium🔎 Chart Context Pattern: A clear Head & Shoulders (H&S) structure has formed. Price is testing the neckline area (~0.126–0.128). Indicators: Stochastic RSI is pushing up from oversold → suggesting temporary relief rally. Price is still inside/near the cloud resistance zone (bearish bias). Target Zone: Marked at 0.090–0.095, aligning with the measured H&S...
🔍 Chart Context Analysis Trend: Clearly bearish structure with persistent lower highs and lower lows. Price Location: Trading below the EMA cloud and under both descending trendlines — shows bearish control. Stochastic RSI (8H): In overbought region and beginning to roll over — early signal of bearish momentum building. MACD/Stochastic Momentum Below: Shows...
📌 Chart Summary Price: ~$115,000 Pattern: Rising Wedge (Bearish) Macro Structure: Completed Cup & Handle Stochastic RSI: Overbought + Bearish cross confirmed Ichimoku Cloud: Price far above cloud – extended EMA/MAs: Bullish but overstretched 🧠 Bias-Free Most Probable Setup (Weekly Outlook) 🟥 Bearish Sniper Setup — High Probability The chart is showing rising...
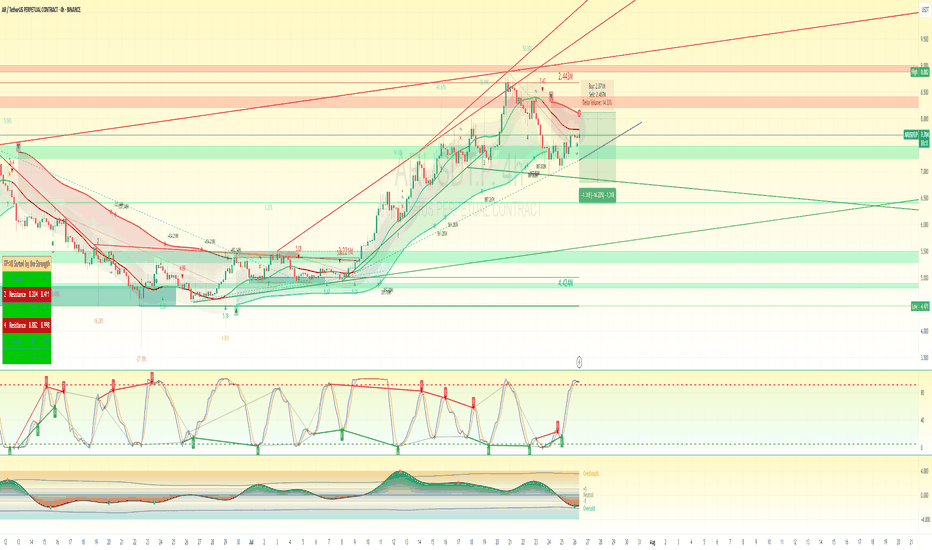
Most Probable Sniper Trade Setup for AR/USDT (4H) Analysis as of current 4H chart provided — Objective, Unbiased, Based on Structure & Momentum 🔍 Trend Context Macro Bias (4H): Bullish recovery after a strong retracement. VIDYA Trend Bands: Price reclaimed below-band zone, pushing into mid-band region, signaling potential mean reversion. Fib Pullback: Price...
🔍 Current Context: Price is trading around $0.13007, just above a major reclaimed support demand zone ($0.126–$0.120). 4H Stochastic RSI is entering the overbought zone (high-risk for new longs). Price has bounced off a local Fib level + trendline cluster. Volume delta favors buys, but candles show hesitation near EMA zone. ✅ Most Probable Trade Setup: Bearish...
Bias: Rejection at weak high above PDH into premium zone with bearish divergence and overbought oscillator 🔍 Confluences: ✅ Price in premium zone ✅ Wick rejection at weak high ✅ Stochastic RSI double top + bearish divergence ✅ Price extended away from 9/EMA baseline ✅ Possible inducement sweep of PDH liquidity ✅ Low volume on final push (distribution...
**Detailed Analysis of RDNT/USDT 5-Day Chart** **1. Trend Analysis** - The chart depicts a **falling wedge pattern**, a bullish reversal signal. - There has been a consistent downtrend with multiple sell signals in the past. - However, recent price action suggests accumulation, with a "Buy" signal appearing at the lower boundary of the wedge. - The stochastic...
Overview The BTC/USDT 2-week chart indicates that Bitcoin has reached a critical resistance zone (~$110K) and is facing overbought conditions based on multiple indicators. There is a high probability of a pullback correction before the next impulsive leg. This analysis identifies key buy and sell zones based on Elliott Wave Theory, Fibonacci retracement levels,...
ETH/USDT Weekly Chart Breakdown 1. Overview of the Chart The chart is a weekly timeframe for ETH/USDT on Binance. Various technical indicators and tools are used, including: Elliott Wave Analysis (Labelled waves 1 to 5, and corrective waves a, b, c). Support and Resistance Zones. Fibonacci Levels & Supply/Demand Zones. Trendlines & Chart Patterns (e.g., Rising...
Key Observations on the Chart: Triangle Pattern: A descending triangle is forming, indicating potential for a breakout. The price is near equilibrium, meaning a strong move is imminent. Falling Wedge Formation (Bullish Reversal Pattern): The pattern near strong support suggests a bullish breakout is likely. Buy and Sell Signals: Buy Zones: Identified near...
1️⃣ Entry Zones (Buying Opportunities) The entry zones are identified based on previous support levels, indicators, and potential reversal points. ✅ Key Buy Zones: Primary Support Zone: $0.01700 - $0.00850 The chart highlights a green accumulation zone (equilibrium area), suggesting this range has been a strong historical support. The stochastic indicator is...
1. **Support & Resistance Zones**: Identifying key levels where price has historically reversed or consolidated. 2. **Head & Shoulders Pattern**: The chart shows an inverse Head & Shoulders, which is a bullish pattern. 3. **Indicators**: - Ichimoku Cloud for trend confirmation - Moving Averages for direction - Stochastic RSI for momentum I'll analyze...
TAO is forming a cup and handle in the 3 days chart. It is currently breaking out of the falling wedge. A break above $682 will send TAO flying to $1,200 - $1,250 in the immediate short time.
TIA is currently at a strong support level and gearing for bullish momentum. Have formed a sweet pattern of higher highs in the long time frame (3-day chart), and we will likely witness a new all-time high in CELESTIA. According to the FIB levels, potential TP prices are: 1) $17 2) $21 3) $33 4) $51 5) $72 6) $85 7) $98 (premium target for this bull run) 8)...
AXS is currently below $10 and will likely hit $20 soon. However, AXS needs to break the falling wedge. The resistances ahead are; $10.94 $12.26 $15.10 $17.79 $20.53 Let's see what happens. Disclaimer: This is not financial advice. Please do your research before taking action.
BTC Is likely to bottom out at $16,380, which is the 1000 EMA on a # days chart. However, if the bulls keep the momentum, we will likely see $28,000 soon. In the immediate short time, BTC is forming a rising wedge on the daily timeframe, which is a bearish pattern; a break below the $19,700 region will see BTC fall to $18100 - $ 16,380. Do not get so excited. Make...
SOL is testing the $33.4 support. If it breaks the support, it will head to the $20 region to find another support. However, there will be a slight recovery to $39. A break above the $39 region will see a heavy rally to the upside. Between $34 to $15 is a perfect accumulation zone for SOL. For proper understanding, watch the video to the end. For more analysis...
BNB TO REBOUND AROUND $185 IF THE DIP CONTINUES The $185 region is the 200 MA line. This will act as support and a good place to buy. BNB will recover very fast. Is a coin to watch after the shake-off. Disclaimer: This is not a piece of financial advice. Just my personal analysis. GOODLUCK ...


