sunya
Premium# NAS100 Comprehensive Technical Analysis & Daily Trading Strategy **Current Position**: 23,514.5 (Aug 23, 2025, 12:50 AM UTC+4) * 🎯 Executive Summary Multi-theory convergence analysis indicates NAS100 at critical inflection point with 65% probability of upward continuation to 24,000-24,600 zone, contingent on breaking 23,640 resistance. --- # 📊...
# GBPUSD Technical Analysis & Forecast **Asset**: GBP/USD **Reference Price**: 1.35557 (August 16th, 2025, 12:50 AM UTC+4) **Analysis Date**: August 17, 2025 ## Executive Summary GBPUSD is positioned at a critical juncture with multiple technical confluences suggesting potential bullish continuation. The pair has shown resilience above key support levels and...
# BANK NIFTY COMPREHENSIVE TECHNICAL ANALYSIS **Asset**: Bank Nifty Index (NSE:BANKNIFTY) **Reference Price**: 55,341.85 (August 14th, 2025, 1:55 PM UTC+4) **Analysis Date**: August 17, 2025 **Current Status**: Major Technical Confluence Zone ## EXECUTIVE SUMMARY Bank Nifty is positioned at a critical technical juncture showing multiple analytical confirmations...
# BTCUSD COMPREHENSIVE TECHNICAL ANALYSIS **Asset**: Bitcoin / US Dollar (BTCUSD) **Reference Price**: $117,498.30 (August 16th, 2025) **Analysis Date**: August 17, 2025 **Market Cap**: ~$2.3 Trillion (estimated) ## EXECUTIVE SUMMARY Bitcoin is experiencing a critical technical juncture following a sharp reversal from recent all-time highs above $124,500. The...
# USDCHF Technical Analysis & Forecast **Base Price:** 0.80676 (August 15, 2025) ## Executive Summary The USDCHF pair at 0.80676 presents a critical juncture with multiple technical confluences suggesting potential directional moves across various timeframes. ## Japanese Candlestick Analysis ### Intraday Patterns (5M-1H) - **Key Reversal Patterns:** Look for...
# DXY (US Dollar Index) Technical Analysis & Forecast **Base Price:** 97.839 (August 16, 2025 - 12:55 AM) ## Executive Summary The DXY at 97.839 shows the USD in a consolidation phase near key technical levels. Multiple analytical frameworks converge around critical support/resistance zones, suggesting an imminent directional breakout within the next trading...
Closing Price: 44,935.4 (16th Aug 2025, 12:50 PM UTC+4) Analysis Methods: Japanese Candlesticks, Harmonic Patterns (ABCD, M/W), Elliott Wave, Wyckoff, Gann Theory (Time/Square of 9/Angles), Ichimoku, RSI, Bollinger Bands, VWAP, Moving Averages (MA/EMA/SMA/WMA). 1. Long-Term Trend (Weekly/Monthly) Elliott Wave: US30 is in Wave 5 of a bull cycle (Wave 3...
Closing Price: 6447.8 (16th Aug 2025, 12:50 PM UTC+4) Analysis Methods: Japanese Candlesticks, Harmonic Patterns (ABCD, M/W), Elliott Wave, Wyckoff, Gann Theory (Time/Square of 9/Angles), Ichimoku, RSI, Bollinger Bands, VWAP, Moving Averages (MA/EMA/SMA/WMA). --------------------------------------------------------------------------------------------- 1....
Closing Price: 23,372.80 (15th Aug 2025, 11:50 PM UTC+4) Analysis Methods: Japanese Candlesticks, Harmonic Patterns (ABCD, M/W), Elliott Wave, Wyckoff, Gann Theory (Time/Square of 9/Angles), Ichimoku, RSI, Bollinger Bands, VWAP, Moving Averages (MA/EMA/SMA/WMA). --------------------------------------------------------------------------------------------- 1....
Closing Price: 23,716.40 (16th Aug 2025, 2:05 AM UTC+4) Analysis Methods: Japanese Candlesticks, Harmonic Patterns (ABCD, M/W), Elliott Wave, Wyckoff, Gann Theory (Time/Square of 9/Angles), Ichimoku, RSI, Bollinger Bands, VWAP, Moving Averages (MA/EMA/SMA/WMA). 1. Long-Term Trend (Weekly/Monthly) Elliott Wave: NAS100 is likely in Wave (V) of a...
Closing Price: $3335.94 (16th Aug 2025, 2:05 AM UTC+4) Analysis Methods: Japanese Candlesticks, Harmonic Patterns (ABCD, M/W), Elliott Wave, Wyckoff, Gann Theory (Time/Square of 9/Angles), Ichimoku, RSI, Bollinger Bands, VWAP, Moving Averages (MA/EMA/SMA/WMA). 1. Long-Term Trend (Weekly/Monthly) Elliott Wave: Gold is likely in Wave 5 of a broader...
Bull Trap Analysis Definition: A bull trap occurs when price breaks above resistance (luring bulls) but reverses sharply downward. Current Evidence: Price Action: Gold rallied to $3397.02 but shows exhaustion signs (e.g., long upper wicks on 4H/daily candles). Volume & VWAP: Declining volume on the breakout + price now below VWAP on 4H charts...
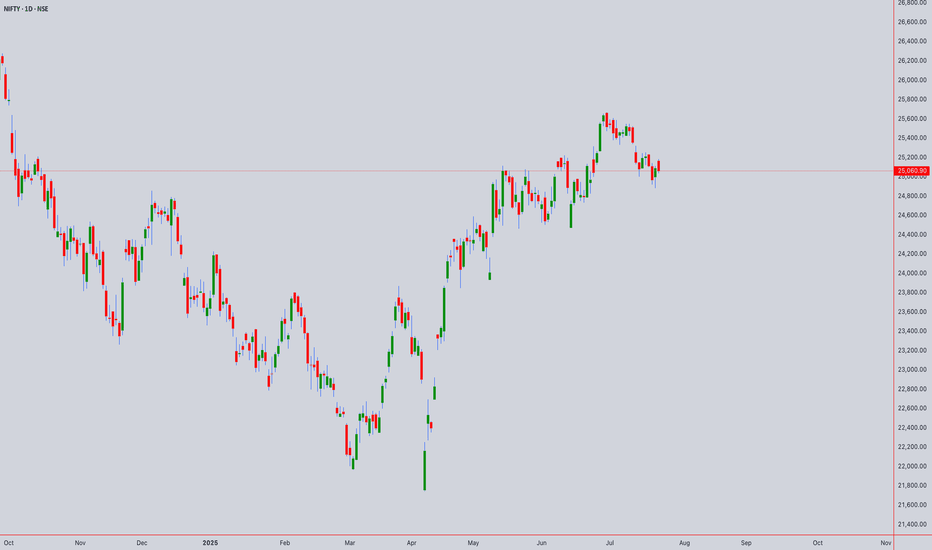
Comprehensive Technical Analysis for NIFTY50 world wide web shunya trade Closing Price: ₹24,722.75 (4th Aug 2025, 02:00PM UTC+4) Time Frames: Intraday: 5M, 15M, 30M, 1H, 4H Swing: 4H, Daily, Weekly, Monthly 1. Japanese Candlestick Analysis Intraday (5M-4H) 4H: Bearish Engulfing at 24,722.75 signals rejection of highs. 1H: Dark Cloud Cover below 24,750...
Open Price: 23242.3 (UTC+4) 1. Japanese Candlestick Analysis 4H/1H: Price opened at 23242.3 near resistance (23250–23300). Recent candles show bearish harami (4H) and dark cloud cover (1H), signaling rejection. 30M/15M: Gravestone doji at 23242.3 and three black crows indicate strong bearish momentum. 5M: Shooting star formation suggests exhaustion. Failure...
1. Japanese Candlestick Analysis 4H/1H: Price opened at 147.056 near resistance (147.00–147.20). Recent candles show bearish engulfing (4H) and dark cloud cover (1H), signaling rejection. 30M/15M: Shooting star at 147.056 and bearish harami indicate exhaustion. Failure to close above 147.20 confirms weakness. 5M: Three black crows pattern emerging, suggesting...
1. Japanese Candlestick Analysis 4H/1H: Price opened at 3374.13 near critical resistance (3375–3380). Recent candles show bearish harami and dark cloud cover, signaling rejection. 30M/15M: Gravestone doji at 3374.13 indicates bearish pressure. Failure to close above 3375 confirms weakness. 5M: Three black crows pattern emerging, suggesting strong short-term...
Open Price: 3365 (UTC+4) 1. Candlestick Analysis 4H/1H: Current price (3365) near resistance zone (3370–3380). Recent candles show shooting stars and bearish engulfing patterns, indicating exhaustion. 30M/15M: Doji formations at 3365 suggest indecision. A close below 3360 would confirm bearish momentum. 5M: Short-term hammer candles at 3355–3360 hint at minor...
Long-Term (Monthly/Weekly) - SWING PERSPECTIVE Trend & Structure: Elliott Wave: Primary Trend: Bullish (Wave 3 or 5 ongoing since 2023). Current Phase: Likely final sub-wave (Wave 5) targeting ₹25,800–26,200. Risk: Completion of Wave 5 may trigger a 10–15% correction (ABC pattern) toward ₹22,500–23,000 (38.2% Fib retracement). Wyckoff &...


