theeonlydave
Xrp had formed an M formation above, has retest current happen with a huge bullish candle upwards but, if you look to your immediate left-hand side you will see that the level 2.9635 is a point of reversal both with your immediate left-hand and further left. Time will only tell with the way the candle will close. And if the setup is not invalidated, we project...
Pepe has an M formation that is clear as day. Price has dropped to a level 0.00000986, pushed upwards to 0.00001055 and has started to form a wick on the resistance which is an indication that price might push downwards to complete the M formation. If price pushes upwards past the resistance then the sell setup would be invalidated.
Xauusd has been respecting the resistance level 3435.361 that each time price hits it, it moves downwards for a sell. The are two clear M formations that have formed, and currently the is the ascending channel where price has broken through,created a retest and is geared to move downwards to complete the M
Bitcoin has formed a falling wedge pattern, the retest as already happened with two candles already closing and the third one currently forming. There is a possibility that it can form another retest before finally moving upwards and this would be the time to enter a buy position (119.223) and ride the move upwards all the way to 131.350 Alternatively one can...
Solana has on the WEEKLY chart shows a clear W formation, on the DAILY chart there is a retest forming a small W formation and on the H4 there is w that later forms an IH&S pattern. All those patterns indicate a move upwards,ideally to complete the bigger picture that is the W.
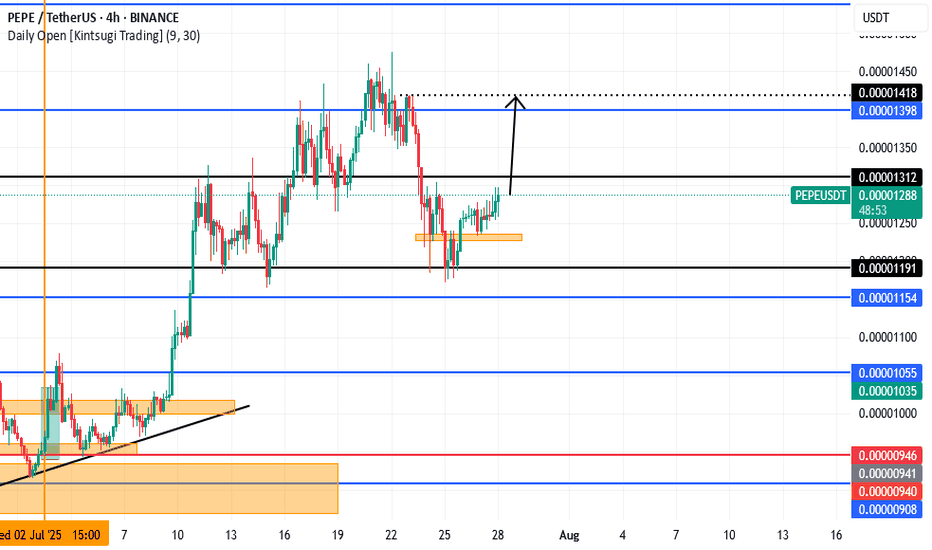
Pepe has formed an (IH&S) pattern and the entry point would be now and then you hold up-to the potential take profit level of 0.00001418
ETH has been rallying upward since 8th may 2025 and is expected to continue moving upwards past 3890.09 all the way to 4101.04 before a re accessing the potential move. The main reason for this is because the price level of 4101.09 was first hit on march 11th 2024,the second touch(even being that there was one on 6th march and another on 16th forming an M...
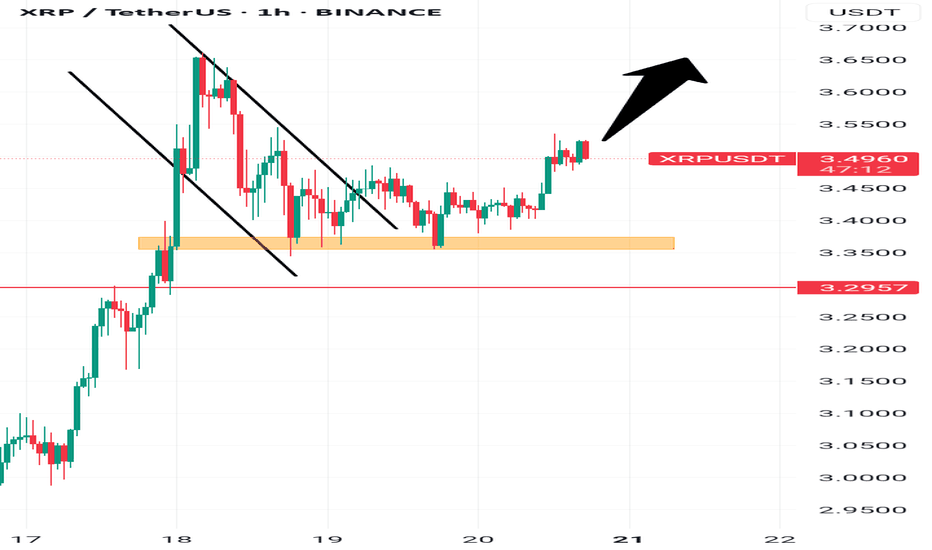
Xrp passed its previous highest high denoted with a red line(resistance level), continued moving upward and created a pull back. On the H1, there is a clear w formation as the bigger structure and a small range followed by a continuous move upwards. The move will continue complete the W formation.
Pepe has shifted and invalidated the bearish structure that would have served us a wonderful sell opportunity. There is a retest, at a support level,once the current candle closes,the movement continues upward all the way to 0.00001312.
There have been powerful formations/patterns that one can always depend on when it comes to bitcoin. W formations,M formations and even triple top formations. Current price has a W formation that is coming to a conclusion and has printed a triple top. If you zoom in at 109160 you will see a small M formation more visible in smaller time frames and gives the hint...
Pepe has been moving within a bearish flag, and now the sell opportunity is almost ripe. An aggressive trader can entry after a breakout to the downside and hold to 0.00000749. Or If you are a conservative trader, wait for a breakout and retest before you enter. Once that happens, enter you sell trades and hold to 0.00000749. Or
There is a H&S pattern that is currently in play, the sell movent has already started but its still in its initial stages. A sell position current with a stop loss slitely above 0.1875 and a take profit at 0.00712 would be most ideal. A conservative trader can go with the most recent structure which would be a continous bearish pattern,if and only if you wait...
Gold seems to be forming the right shoulder of and inverse head and shoulders pattern (IH&S) which would thus translate to a push upwards to 3391.355 to complete the pattern. Equally there is a bullish channel with a clear M at the top where the bearish movement began. There is a consolidation without a clear indication of whether its a continuous bearish...
Gold had formed a W formation and moved upward quite a bit, it has created a pull back with the current bearish candle that has a nice wick. It is also on a support, which evidence of the continuous bearish pattern on the left. Entry at this point would be good in order to have a smaller stop loss.
There is an M formation , followed by a bearish continuous pattern to finish the m structure
Eurusd had a consolidation phase or a bullish flag and there is already a breakout to the upside. You can be aggressive and enter or wait for a retest and then enter
Gold seems to be printing a W or double bottom. Once it passes the black horizontal line then one can take the buy but with a big stop loss. If you are aggressive, you can enter now.
CAR has been falling for a while.It has started to create a wick on the daily time frame. It shows a possible buy but it can also drop all the way to the red line and then start moving upwards. Its just a matter of time.


