veyasins
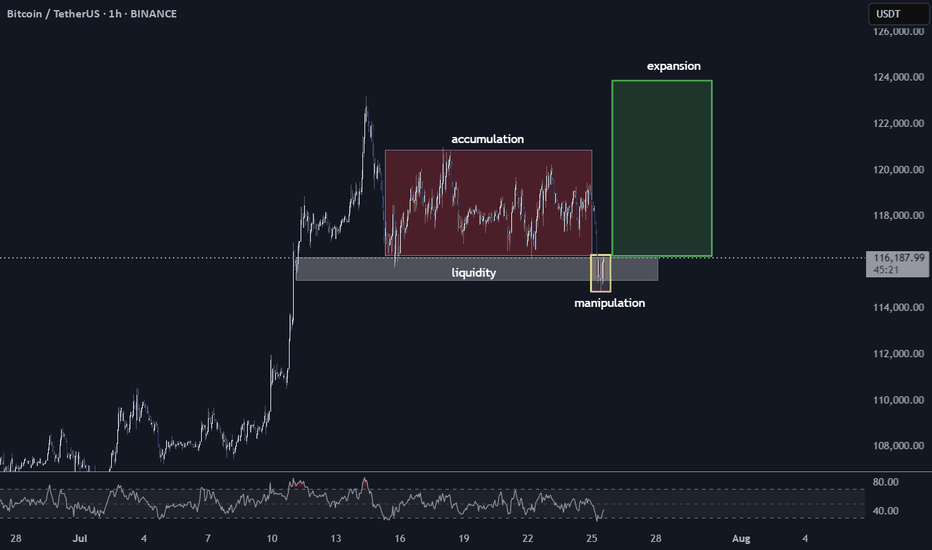
We've just witnessed a textbook price action sequence unfold. After a period of what I've marked as 'accumulation' (that red box), where price consolidated, we saw exactly what we were looking for: the 'liquidity' below that range (the grey box) has been swept. That yellow bar clearly indicates the 'manipulation' phase, pushing below the perceived support to trap...
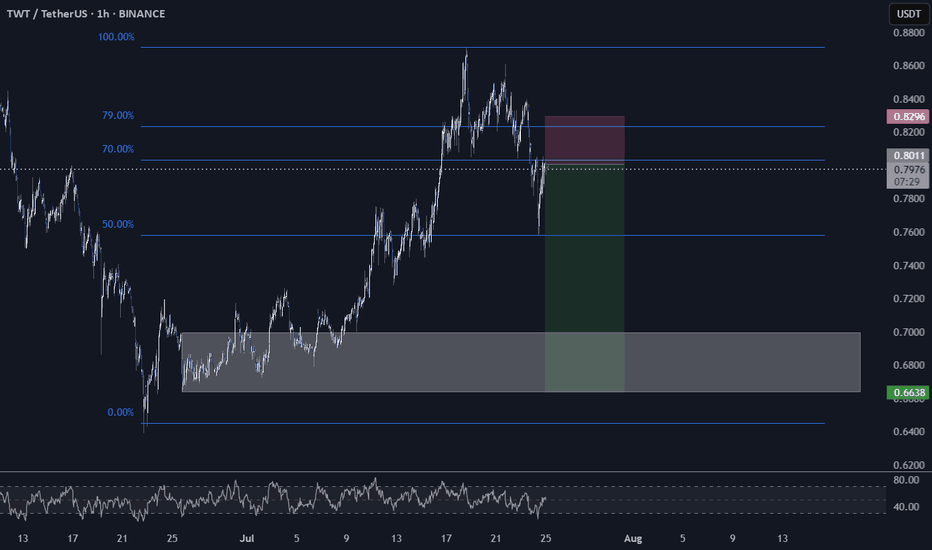
We can clearly see that price has recently touched the 0.5 Fibonacci retracement level and subsequently pulled back to the 0.7 region. What's particularly interesting to me is that the liquidity within that grey box below hasn't been swept yet. My current conviction is that price is likely headed down to that grey zone to collect the pending liquidity. This area...
Rsi and everything is in dip. Dip can be 39k or 38k. If it break supports with high volume, it can be bearish but we dont think so. Don't forget this things, we're in bullish market.
After breaking 3.80 the target will be 4.45, not financial advice


