wallstmetrics
PlusLast seen
Followers
1Following
0Ideas
2Scripts
0Joined Jul 16, 2025
trendanalysis
Less Tags
Show All Tags
All Types
Type
All Types
Indicators
Strategies
Libraries
All Accesses
Script access
All Accesses
Open
Protected
Invite-only
Public & Private
Privacy
Public & Private
Public
Private
This is a 15-minute timeframe chart, where each candlestick represents 15 minutes of trading activity. It is primarily used by intraday traders and scalpers to identify short-term trends, breakout zones, and momentum plays. This chart of the S&P 500 (SPX) reflects intraday movements with real-time tracking of support/resistance zones, volume spikes, and...
1
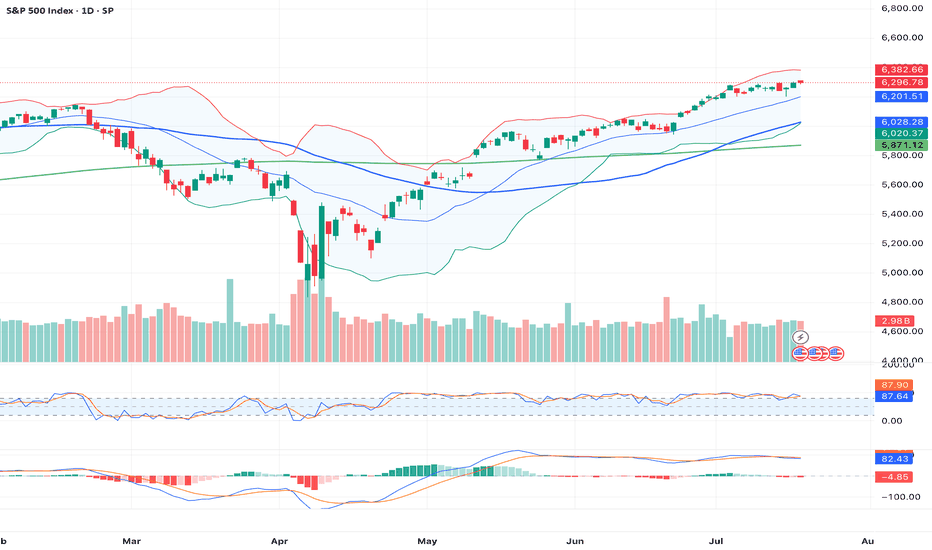
This chart represents the 1-day (Daily timeframe) price action of the S&P 500 Index (SPX), offering a focused view of market sentiment, key levels, and trend momentum as of . Each candlestick reflects a full trading day. 📊 Chart Parameters: Instrument: S&P 500 Index (SPX) Timeframe: 1D (1-Day) Exchange: NYSE / NASDAQ Composite (tracked as index) Date Range...
2
0
0
0
Message
Follow
Following
Unfollow
User follows nobody
Type
Script access
Privacy

