(XAU/USD) 4H Chart Analysis – Potential Bullish Breakout Ahead Current Price: 3,350.97 Trend Bias: Bullish (short-to-mid term) Indicators: EMA (9, close): Price is currently holding above the EMA, indicating short-term bullish momentum. Volume: Steady with occasional spikes during upside moves, hinting at buying interest on dips. Technical Overview: Gold is...
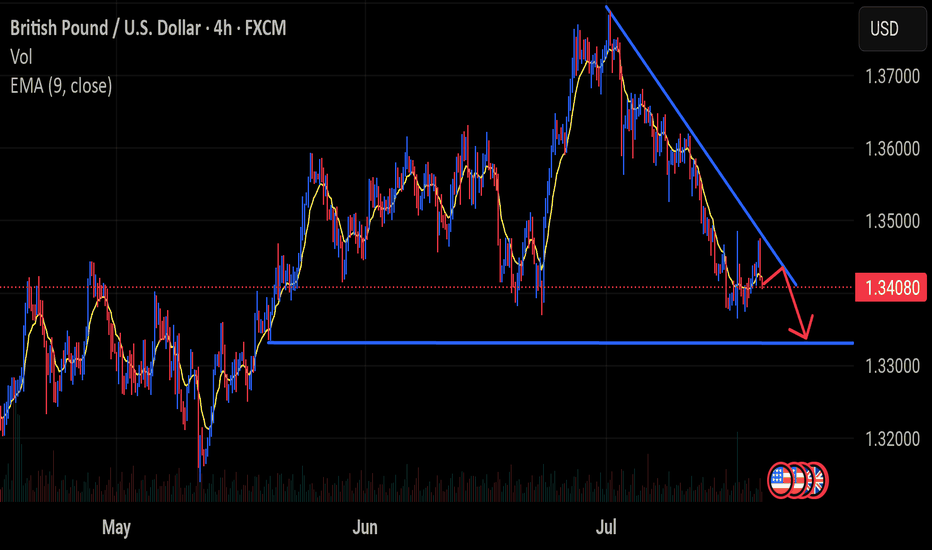
GBP/USD 4H Chart Analysis – Bearish Setup in Play Current Price: 1.34080 Trend Bias: Bearish (short-term) Indicators: EMA (9, close) – Price is consistently trading below the 9 EMA, reinforcing bearish momentum. Volume: No significant uptick in buying activity; selling pressure remains dominant. Technical Overview: The GBP/USD pair is currently exhibiting a...
GBP/USD 4H Chart Analysis – Bearish Setup in Play Current Price: 1.34080 Trend Bias: Bearish (short-term) Indicators: EMA (9, close) – Price is consistently trading below the 9 EMA, reinforcing bearish momentum. Volume: No significant uptick in buying activity; selling pressure remains dominant. Technical Overview: The GBP/USD pair is currently exhibiting a...
This is a bullish counter-trend trade setup on USD/JPY, aiming to catch a reversal or retracement. The trader is betting on a short-term bullish move, with a good RRR and a TP just below the 200 EMA — a smart technical consideration. However, caution is advised since price is still under the EMA, indicating possible bearish continuation unless a strong breakout occurs.
📉 USD/JPY – Short Setup in Play After Major Rally 🗓️ Published May 12, 2025 | 4H Chart | OANDA After a strong bullish surge in USD/JPY, price has now tapped into a key resistance zone near 148.875, aligning closely with prior supply and the declining 200 EMA. This area also coincides with a psychological resistance level. 💡 A short position has been initiated...
Trend: Strong recent bullish momentum. Current Price: ~195.458 JPY. Setup: A short (sell) position is marked, suggesting a potential reversal. Stop-Loss: Around 195.924. Take-Profit: Around 193.649. Volume: Spiked during the breakout, now stabilizing. EMA 200: Price is well above, indicating strong upward bias, but overbought risk.
📈 GBPJPY – Bullish Breakout | Long Setup Active 🇬🇧💴 GBP/JPY is showing a clear bullish structure on the 1H chart. Price has broken above a key resistance zone and reclaimed the 200 EMA with strong momentum and volume. This marks a potential trend reversal and the beginning of an uptrend. 🔹 Entry: 193.400 🔹 Stop Loss: 192.935 (below recent support) 🔹 Take...


