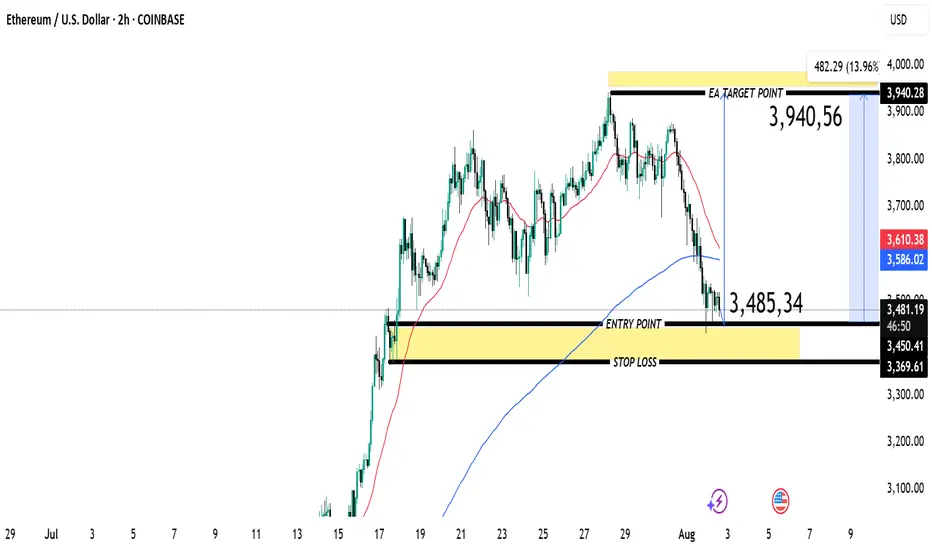
ETH/USD (Coinbase)
Timeframe: 2-hour
Current Price: ~$3,485.73
Indicators:
Red Line: Likely a short-term moving average (e.g., 20 EMA)
Blue Line: Longer-term moving average (e.g., 50 or 100 EMA)
Pattern: A pullback toward previous support after a significant rally
✅ Trade Setup Details
Entry Point: ~$3,485.34
This level aligns with prior consolidation and support zone (yellow highlighted area)
Stop Loss: ~$3,369.61
Placed below the support block to allow room for volatility
Target Point: ~$3,940.56
A retest of previous swing highs
✅ Risk/Reward
Potential Upside: ~13.96% move (approx. +$482)
Risk: About $115 per ETH
Reward/Risk Ratio: ~4:1
Favorable, as rewards significantly exceed the risk
✅ Technical Context
Price Action:
Recent downward retracement after peaking near $3,940
Testing a major support (highlighted in yellow)
If this support holds, there is potential for a reversal rally toward target
Moving Averages:
Price is near/below the red short-term moving average, signaling recent bearish momentum
A bounce from this zone could confirm a higher low formation
Key Confirmation:
Strong bullish candle or rejection wick from the support zone would strengthen the long bias
✅ Summary of the Setup
This chart outlines a long trade opportunity:
Entry near: $3,485
Stop below: $3,369
Target: ~$3,940
Rationale: Buying into a well-established support zone anticipating a rebound to retest prior highs.
If you’d like, I can help you:
Assess alternative targets
Discuss scaling entries
Review other timeframes for confluence
Trade active
Join my telegram (COPY_TRADE)
t.me/TOP1INVEESTADMEN
Join my refrel broker link
one.exnesstrack.org/a/l1t1rf3p6v
t.me/TOP1INVEESTADMEN
Join my refrel broker link
one.exnesstrack.org/a/l1t1rf3p6v
Disclaimer
The information and publications are not meant to be, and do not constitute, financial, investment, trading, or other types of advice or recommendations supplied or endorsed by TradingView. Read more in the Terms of Use.