ETHUSD Descending Triangle Breakdown SetupThis 2H ETH/USD chart highlights a descending triangle structure forming after a prior impulse move. Price is consistently making lower highs beneath a descending trendline, while holding a horizontal support zone around 2,890–2,900, signaling growing bearish pressure.
A clear CHoCH (Change of Char
Key facts today
Key stats
About Ethereum
Ethereum — the world’s second-most famous blockchain network — is a platform for creating decentralized applications based on blockchain and smart contract technology (a command that automatically enforces the terms of the agreement based on a given algorithm). It's the chain that birthed DeFi (decentralized finance) and started the NFT craze which saw billions of dollars pour into cryptocurrency. Safe to say, it's one of the big dogs.
Related coins

LOOK OUT FOR ETHERUM HIGH PROBABILITY LONG SETUP SOON!!!🚨ETHER HIGH PROBABILITY BUY SETUP 🚨
* Here We Can See Clearly The Next Potential Moves For ETHUSD Coming Hours/Days.
* Keep Your Eyes Close On Your Trading Positions.
* Happy PIP Hunting Traders.
FXKILLA.

The Chronicles of Ethereum: “A story of overconfident bears.”Hello Traders,
I will start by saying that this idea is not financial advice , and as always make sure to do your own research. My invalidation level is 2800. Ok lets get into it…
3 levels to watch : 2963, 3075 & 3178. I believe that any genuine upward momentum through these levels should trigger

Ethereum at the Edge: Compression, Volatility & the Next RegimeThis idea looks at Ethereum through a volatility, volume, and macro lens.
To frame this properly, I’m using volume and a loosely defined time boundary that aligns with what many perceive as the four-year cycle in crypto markets. The goal isn’t to be exact, but to highlight key volume inflection poi

ETHUSD – H4 Analysis ETHUSD – H4 Analysis (based on My chart)
Market Structure
Price is recovering from a strong demand zone (yellow).
Currently trading below major resistance, inside a corrective structure.
Ichimoku cloud acting as resistance, but short-term bounce continuation is visible.
This looks like a pullback-bu

ETH SELL SETUP ACTIVEETH SELL SETUP ACTIVE ⚡
📌 Trade Plan:
🔓 Entry: 2900 - 2890
❌ Stop Loss: 2860
🎯 Target: 2960
ETH rejected from a strong supply zone after showing clear weakness and momentum shift. Smart money distribution + structure break confirms a high-probability sell. Clean risk management, clear levels — tra

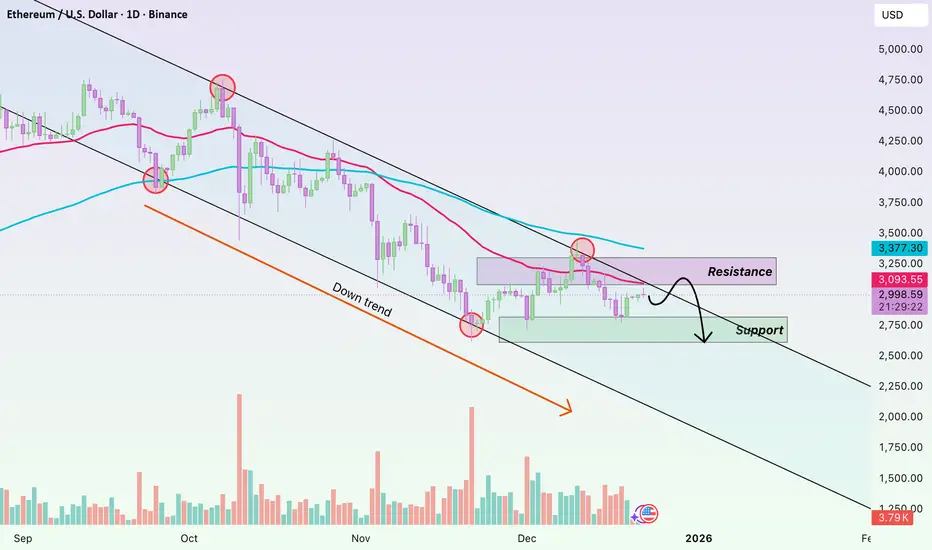
ETHUSD – Technical Rebound Within a DowntrendHello, this is Domic.
Looking at the ETH daily chart, the current picture is quite clear: the primary trend remains bearish, and the recent upside move should only be viewed as a technical rebound.
Price is still trading below both EMA34 and EMA89, with EMA34 having crossed below EMA89 and both m
ETH - Time to buy again!The price can form a head and shoulders pattern. If that is happen, expect a significant price increase.

ETHUSD bullish fractalEhereum is repeat bullish patterns that did in previous cycles.
-ETH exited the consolidation triangle that started from nov 21, and now is retesting the structure, meaning a bullish continuation is likely to happen.
-In adition, there is an inverted head and shoulders that is taking shape.
I a

ICT Trader - Top Down Analysis on ETH!Guys this is the first time I’ve fully broken down exactly how I trade crypto using the ICT strategy step by step, top down.
In this video, I take you through my entire charting process, starting from the monthly timeframe all the way down to the 1 hour, explaining how I build conviction, define bi

See all ideas
Summarizing what the indicators are suggesting.
Oscillators
Neutral
SellBuy
Strong sellStrong buy
Strong sellSellNeutralBuyStrong buy
Oscillators
Neutral
SellBuy
Strong sellStrong buy
Strong sellSellNeutralBuyStrong buy
Summary
Neutral
SellBuy
Strong sellStrong buy
Strong sellSellNeutralBuyStrong buy
Summary
Neutral
SellBuy
Strong sellStrong buy
Strong sellSellNeutralBuyStrong buy
Summary
Neutral
SellBuy
Strong sellStrong buy
Strong sellSellNeutralBuyStrong buy
Moving Averages
Neutral
SellBuy
Strong sellStrong buy
Strong sellSellNeutralBuyStrong buy
Moving Averages
Neutral
SellBuy
Strong sellStrong buy
Strong sellSellNeutralBuyStrong buy
Displays a symbol's price movements over previous years to identify recurring trends.
Curated watchlists where ETHUSD is featured.

Gen 2: Crypto is here to stay - and it's brought some friends…
19 No. of Symbols

Proof of Work: Embracing the crunch
27 No. of Symbols

Smart contracts: Make the smart decision
36 No. of Symbols

Staking Coins: Pick up a stake
18 No. of Symbols

Top altcoins: Choose your alternatives carefully
28 No. of Symbols
See all sparks
Discover funds exposed to Ethereum and find the best way to access the coin.
Frequently Asked Questions
The current price of Ethereum (ETH) is 2,974.79 USD — it has risen 0.44% in the past 24 hours. Try placing this info into the context by checking out what coins are also gaining and losing at the moment and seeing ETH price chart.
The current market capitalization of Ethereum (ETH) is 359.04 B USD. To see this number in a context check out our list of crypto coins ranked by their market caps or see crypto market cap charts.
Ethereum (ETH) trading volume in 24 hours is 16.24 B USD. See how often other coins are traded in this list.
Ethereum price has risen by 1.18% over the last week, its month performance shows a 6.49% increase, and as for the last year, Ethereum has decreased by −10.68%. See more dynamics on ETH price chart.
Keep track of coins' changes with our Crypto Coins Heatmap.
Keep track of coins' changes with our Crypto Coins Heatmap.
Ethereum (ETH) reached its highest price on Aug 24, 2025 — it amounted to 4,955.90 USD. Find more insights on the ETH price chart.
See the list of crypto gainers and choose what best fits your strategy.
See the list of crypto gainers and choose what best fits your strategy.
Ethereum (ETH) reached the lowest price of 5.81 USD on Dec 6, 2016. View more Ethereum dynamics on the price chart.
See the list of crypto losers to find unexpected opportunities.
See the list of crypto losers to find unexpected opportunities.
The current circulating supply of Ethereum (ETH) is 120.69 M USD. To get a wider picture you can check out our list of coins with the highest circulating supply, as well as the ones with the lowest number of tokens in circulation.
The safest choice when buying ETH is to go to a well-known crypto exchange. Some of the popular names are Binance, Coinbase, Kraken. But you'll have to find a reliable broker and create an account first. You can trade ETH right from TradingView charts — just choose a broker and connect to your account.
Crypto markets are famous for their volatility, so one should study all the available stats before adding crypto assets to their portfolio. Very often it's technical analysis that comes in handy. We prepared technical ratings for Ethereum (ETH): today its technical analysis shows the neutral signal, and according to the 1 week rating ETH shows the sell signal. And you'd better dig deeper and study 1 month rating too — it's neutral. Find inspiration in Ethereum trading ideas and keep track of what's moving crypto markets with our crypto news feed.
Ethereum (ETH) is just as reliable as any other crypto asset — this corner of the world market is highly volatile. Today, for instance, Ethereum is estimated as 0.61% volatile. The only thing it means is that you must prepare and examine all available information before making a decision. And if you're not sure about Ethereum, you can find more inspiration in our curated watchlists.
You can discuss Ethereum (ETH) with other users in our public chats, Minds or in the comments to Ideas.